

Overview
The environmental consequences of tiny quantities can be huge. But people often wonder, when considering a number like 400 parts per million, 0.04%—the concentration of carbon dioxide in Earth's atmosphere—how such a small component can have a significant impact. In this activity we use dye and water to show how big a tiny change can be.
Introduction
Grade Level
6-8, 9-12, 13-14
This activity can be completed by middle school students. It can be made more quantitative for high school and undergraduate students (see below).Learning Objectives
Students will
- set up and conduct an experiment to measure the absorbance of light by trace quantities of dye
- practice recording and graphing data
- analyze and interpret their results
- extend their results to consider the absorption of energy by trace gases in the Earth's atmosphere
Lesson Format
Time Required
One class period.
Standards
NGSS:
Analyzing & Interpreting Data
PS4.B Electromagnetic Radiation
ESS3.D Global Climate Change
Cause and Effect: Mechanism and Explanation
NGSS Energy and Matter
Credits & Contact Info
Dr. Alexandra Moore
Paleontological Research Institution, 1259 Trumansburg Rd., Ithaca NY 14850
moore@priweb.org
Instructions & Materials
Resources
- Video | Parts per Million: A Little is a LOT | In the Greenhouse #18
- Video | CO2 Absorbs IR Energy: An Art X Science Climate Change Collab | In the Greenhouse #21
- Video Short | Watch CO2 Cross the Street | In the Greenhouse #19
- Video | Virtual Experiment Time Lapse
- Data spreadsheet for virtual lab (xlsx, 297 kB)
- Instructor Handout (pdf, 8.2 MB)
- Student Handout (pdf, 5.8 MB)
Materials
One set of materials for each group of 2-5 students, or a single set for a teacher-led demo.
- One-liter clear plastic or glass container; ideally with a rectangular(ish) cross-section
- Liquid food coloring w dropper
- Desk lamp
- Light meter (optional)
- Phone or camera to photograph the experiment
- Stirring rod
- Lab coat or similar, and paper towels
The photographs below show the experimental set-up, both from the side and from the top (top view has food coloring added). The container here is a one-liter plastic juice bottle with a rounded rectangular cross-section. The plastic is dimpled near the top and bottom of the container, but smooth where the label has been peeled off. The smooth flat vertical sides of this bottle are ideal for this experiment as there is no distortion when light passes through the container, as would be the case with a cylindrical soda bottle, and, if the container is slightly off-center, or gets bumped during the experiment there is very little change in the path of the light through the container. This is important if you ask the students to quantify the color change as they add drops of food coloring to the container.
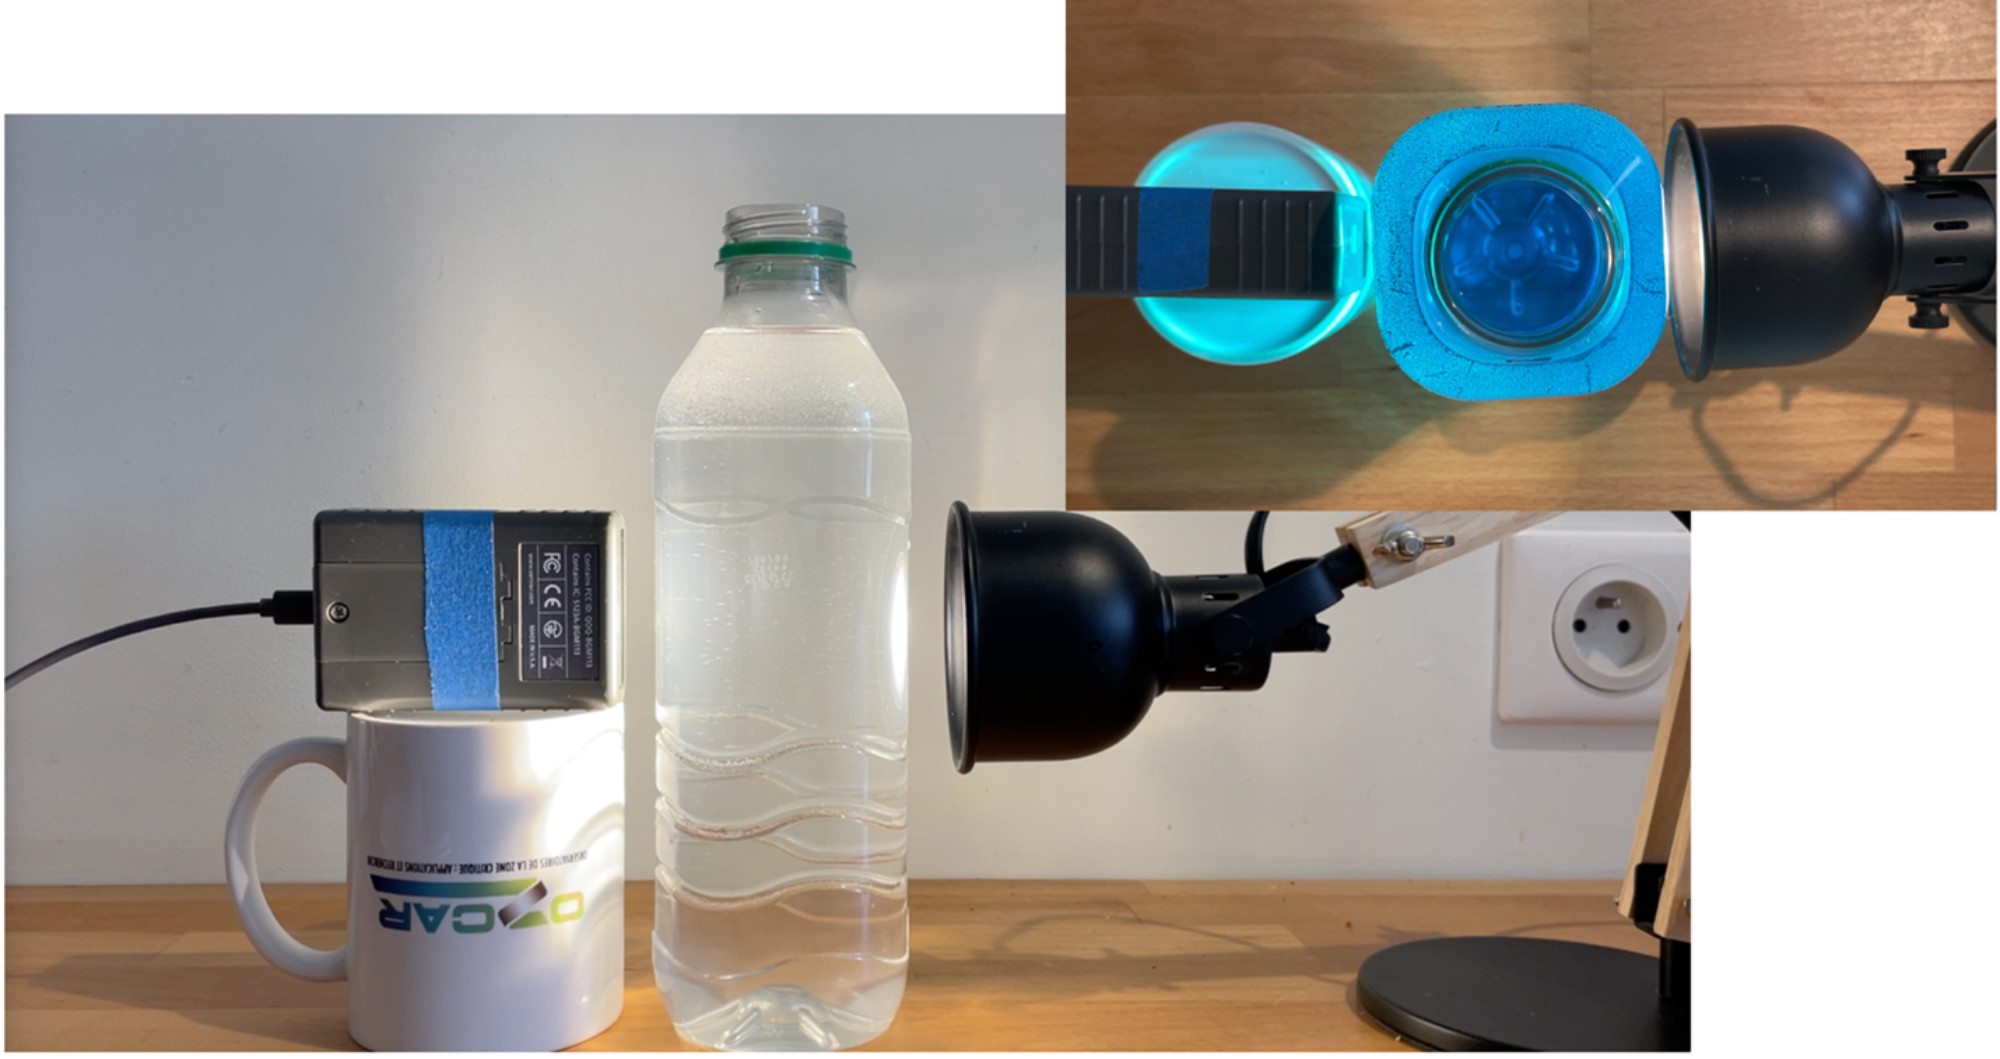
Figure 1: Experimental set-up with one-liter plastic bottle, desk lamp and light meter. Inset is view from above.
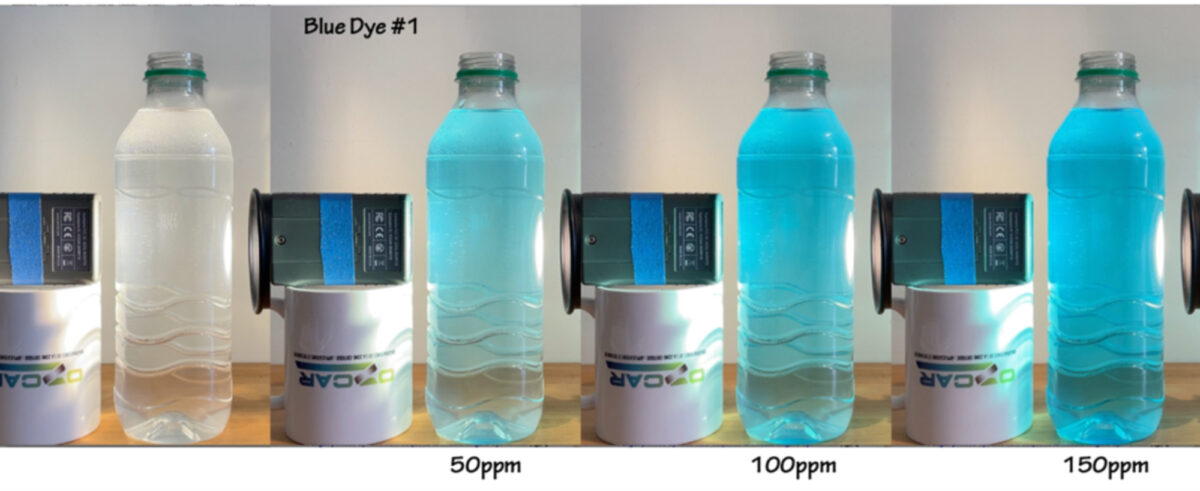
The food coloring shown here is FD&C Blue #1 (also called Brilliant Blue FCF and E133). It is widely used in foods, globally, and is considered safe to eat. Note, however, that any dye WILL stain clothes.
The light meter shown here is a Vernier Go-Direct Light & Color Sensor. This sensor is fun in this application because we can look at red and blue light absorbance separately, and this meter connects to a smart phone via Bluetooth so that we can automatically log the data. Any light meter will give an interesting result, or you can simply gage the results visually with no light meter at all. You can also use an app on your phone, but we find some of the (free) light meter apps to be rather fussy and sensitive to disturbance.
The Experiment
Once the bottle, lamp, and light meter are aligned, students will add food coloring to the bottle, one drop at a time, stir, then observe the color change. A standard "drop" is assumed to have a volume of 0.05 ml. Because the concentration of dye in the food coloring may vary, and the size of the student's drops may vary, this experiment is not strictly quantitative. But the observed changes are large enough that the approximate concentrations are fine for this purpose.
If you are using a digital light meter with a smartphone or computer interface you can record the light absorbance data as the students conduct the experiment. The handouts that accompany this activity are written for a digital light meter, but can be modified to be either less, or more, quantitative.
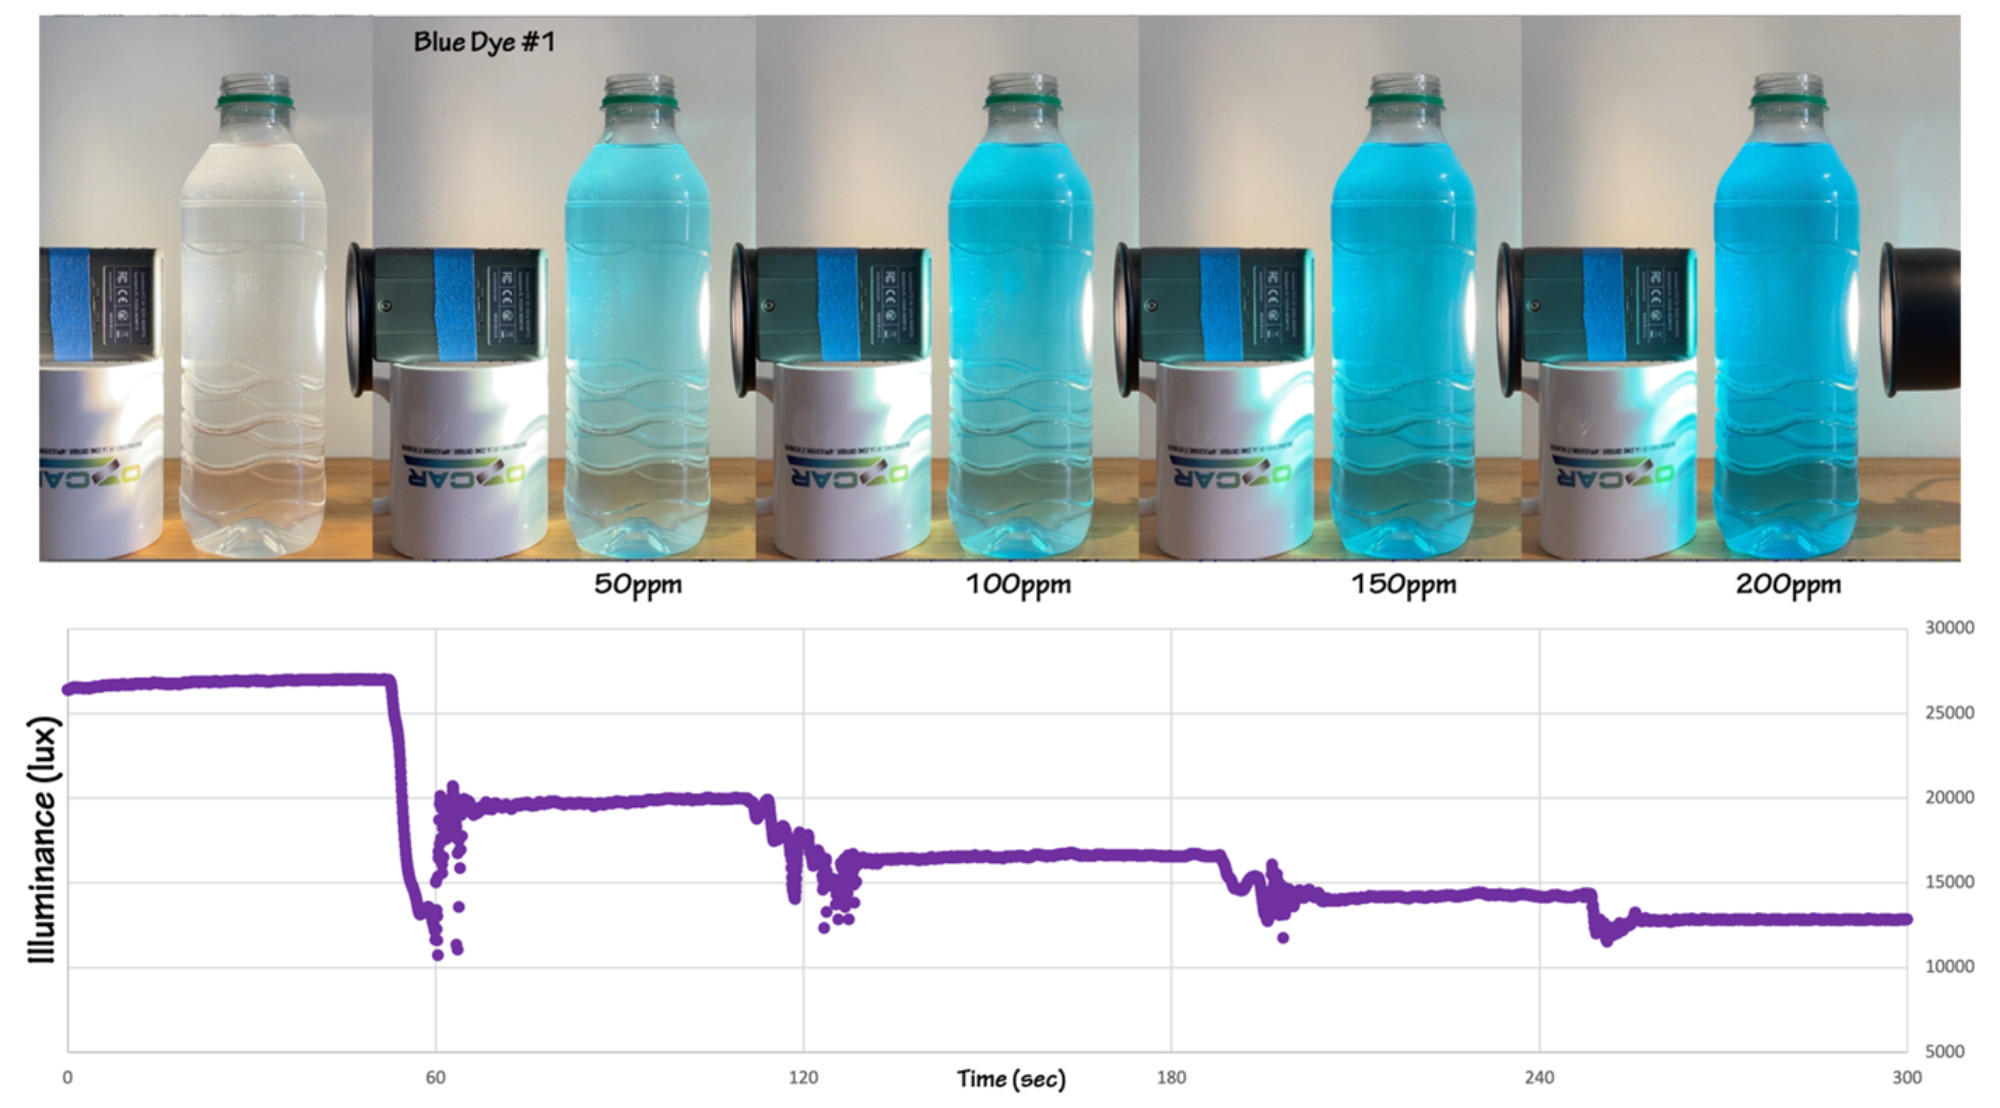
Figure 2: Experimental results for four drops of blue dye, added approximately one minute apart. The noisy data that mark each increment is the result of stirring. Figure by Alexandra Moore for PRI's Earth@Home project (CC BY-NC-SA 4.0 license)
The Student and Teacher handouts describe the step-by-step procedure for these experiments. Continue to the Background and Extensions section, below, for experiment tips, advice and ideas for additional experiments.
Virtual Lab
This activity can be done as a virtual lab by watching the experiment video and downloading the data spreadsheet.
Background & Extensions
Why?
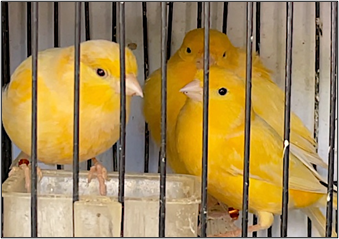
Canaries were used in coal mines from the 19th century into the 1980s to protect miners from carbon monoxide (CO) poisoning. Canaries are a sentinel species, more sensitive to toxic gases than humans, and could thus provide a warning to miners when air quality became hazardous. The current EPA air quality standard for CO is 9 ppm. Human exposure to CO concentrations above150 ppm can be fatal.
Carbon monoxide is just one of many chemicals that can be hazardous to humans and to ecosystems when present even at very low concentrations. A second example comes from the 2014 water crisis in the city of Flint, MI, where domestic water supplies in scores of homes were found to contain more than 100 parts per billion dissolved lead. The EPA threshold for lead is 15 ppb, and its target level is zero. Children are especially at risk; there is no safe level of lead in drinking water.
Despite widespread appreciation of the impact of low concentrations of many environmental contaminants, there is a stubborn skepticism among a segment of our population regarding the impact of 420 ppm CO2 in Earth's atmosphere. Some individuals ask how a quantity that represents 0.04% of the atmosphere could possibly affect global climate? Yet we see the consequences of ppm and ppb abundances all around us - to the point where canaries accompanied coal miners on the job, every day.
The purpose of this experiment is to use a benign material - food coloring - to illustrate the impact of trace quantities, in order to better understand the importance of trace quantities of environmental contaminants. This experiment is particularly relevant to the behavior of CO2 in the atmosphere, as the dye molecules here and CO2 in the atmosphere both absorb specific wavelengths of sunlight. In our experiment the consequence is visible, which can help students understand the invisible behavior of CO2 in the atmosphere.
What?
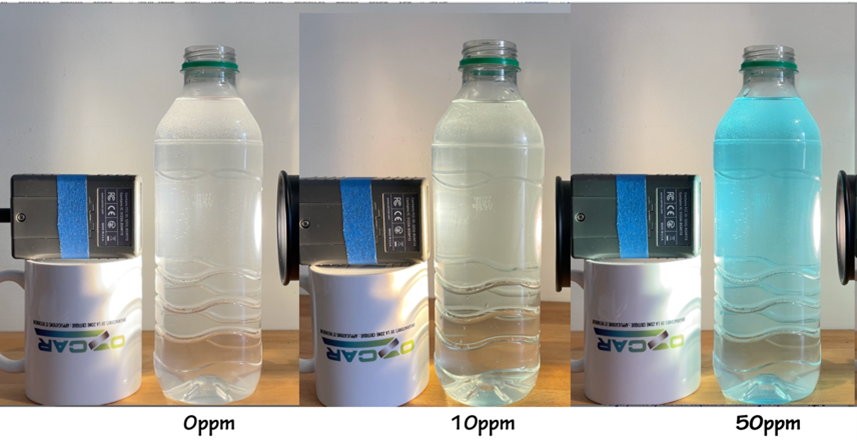
We can use non-toxic food dyes to visualize changes caused by trace components in water. In this case we will look at the absorption of light as it passes through a water sample. Dye concentrations as low as 10 ppm are easily visible, and at 100 ppm water is brightly colored.
This experiment is configured to pass white light through a transparent container full of water. A light meter on the opposite side allows any change in the transmission of light due to addition of dye to be detected and recorded. Using a container volume of one liter simplifies calculation of the concentration of dye in the water. We sequentially add drops of dye and record the change. It is a common convention to assume that one drop of liquid has a volume of 0.05 ml.
For 1 drop = 0.05 ml the concentration of dye is 0.05 ml/1000 ml = 5x10-5 = 50 ppmv.
Parts per Million by Mass and Volume
- ppm on a mass basis (ppm, or milligram/liter) is calculated by dividing the mass of the substance in question by the total mass of the mixture, and then multiplying by 1,000,000. This is often used for measuring the concentration of a dissolved substance in a liquid.
- ppm on a volume basis (ppmv) is calculated by dividing the volume of the substance in question by the total volume of the mixture, and then multiplying by 1,000,000. This is often used for measuring the concentration of a gas in a gas mixture.
In this experiment we are adding 0.05 ml dye to 1000 ml water, so the units are ppmv.
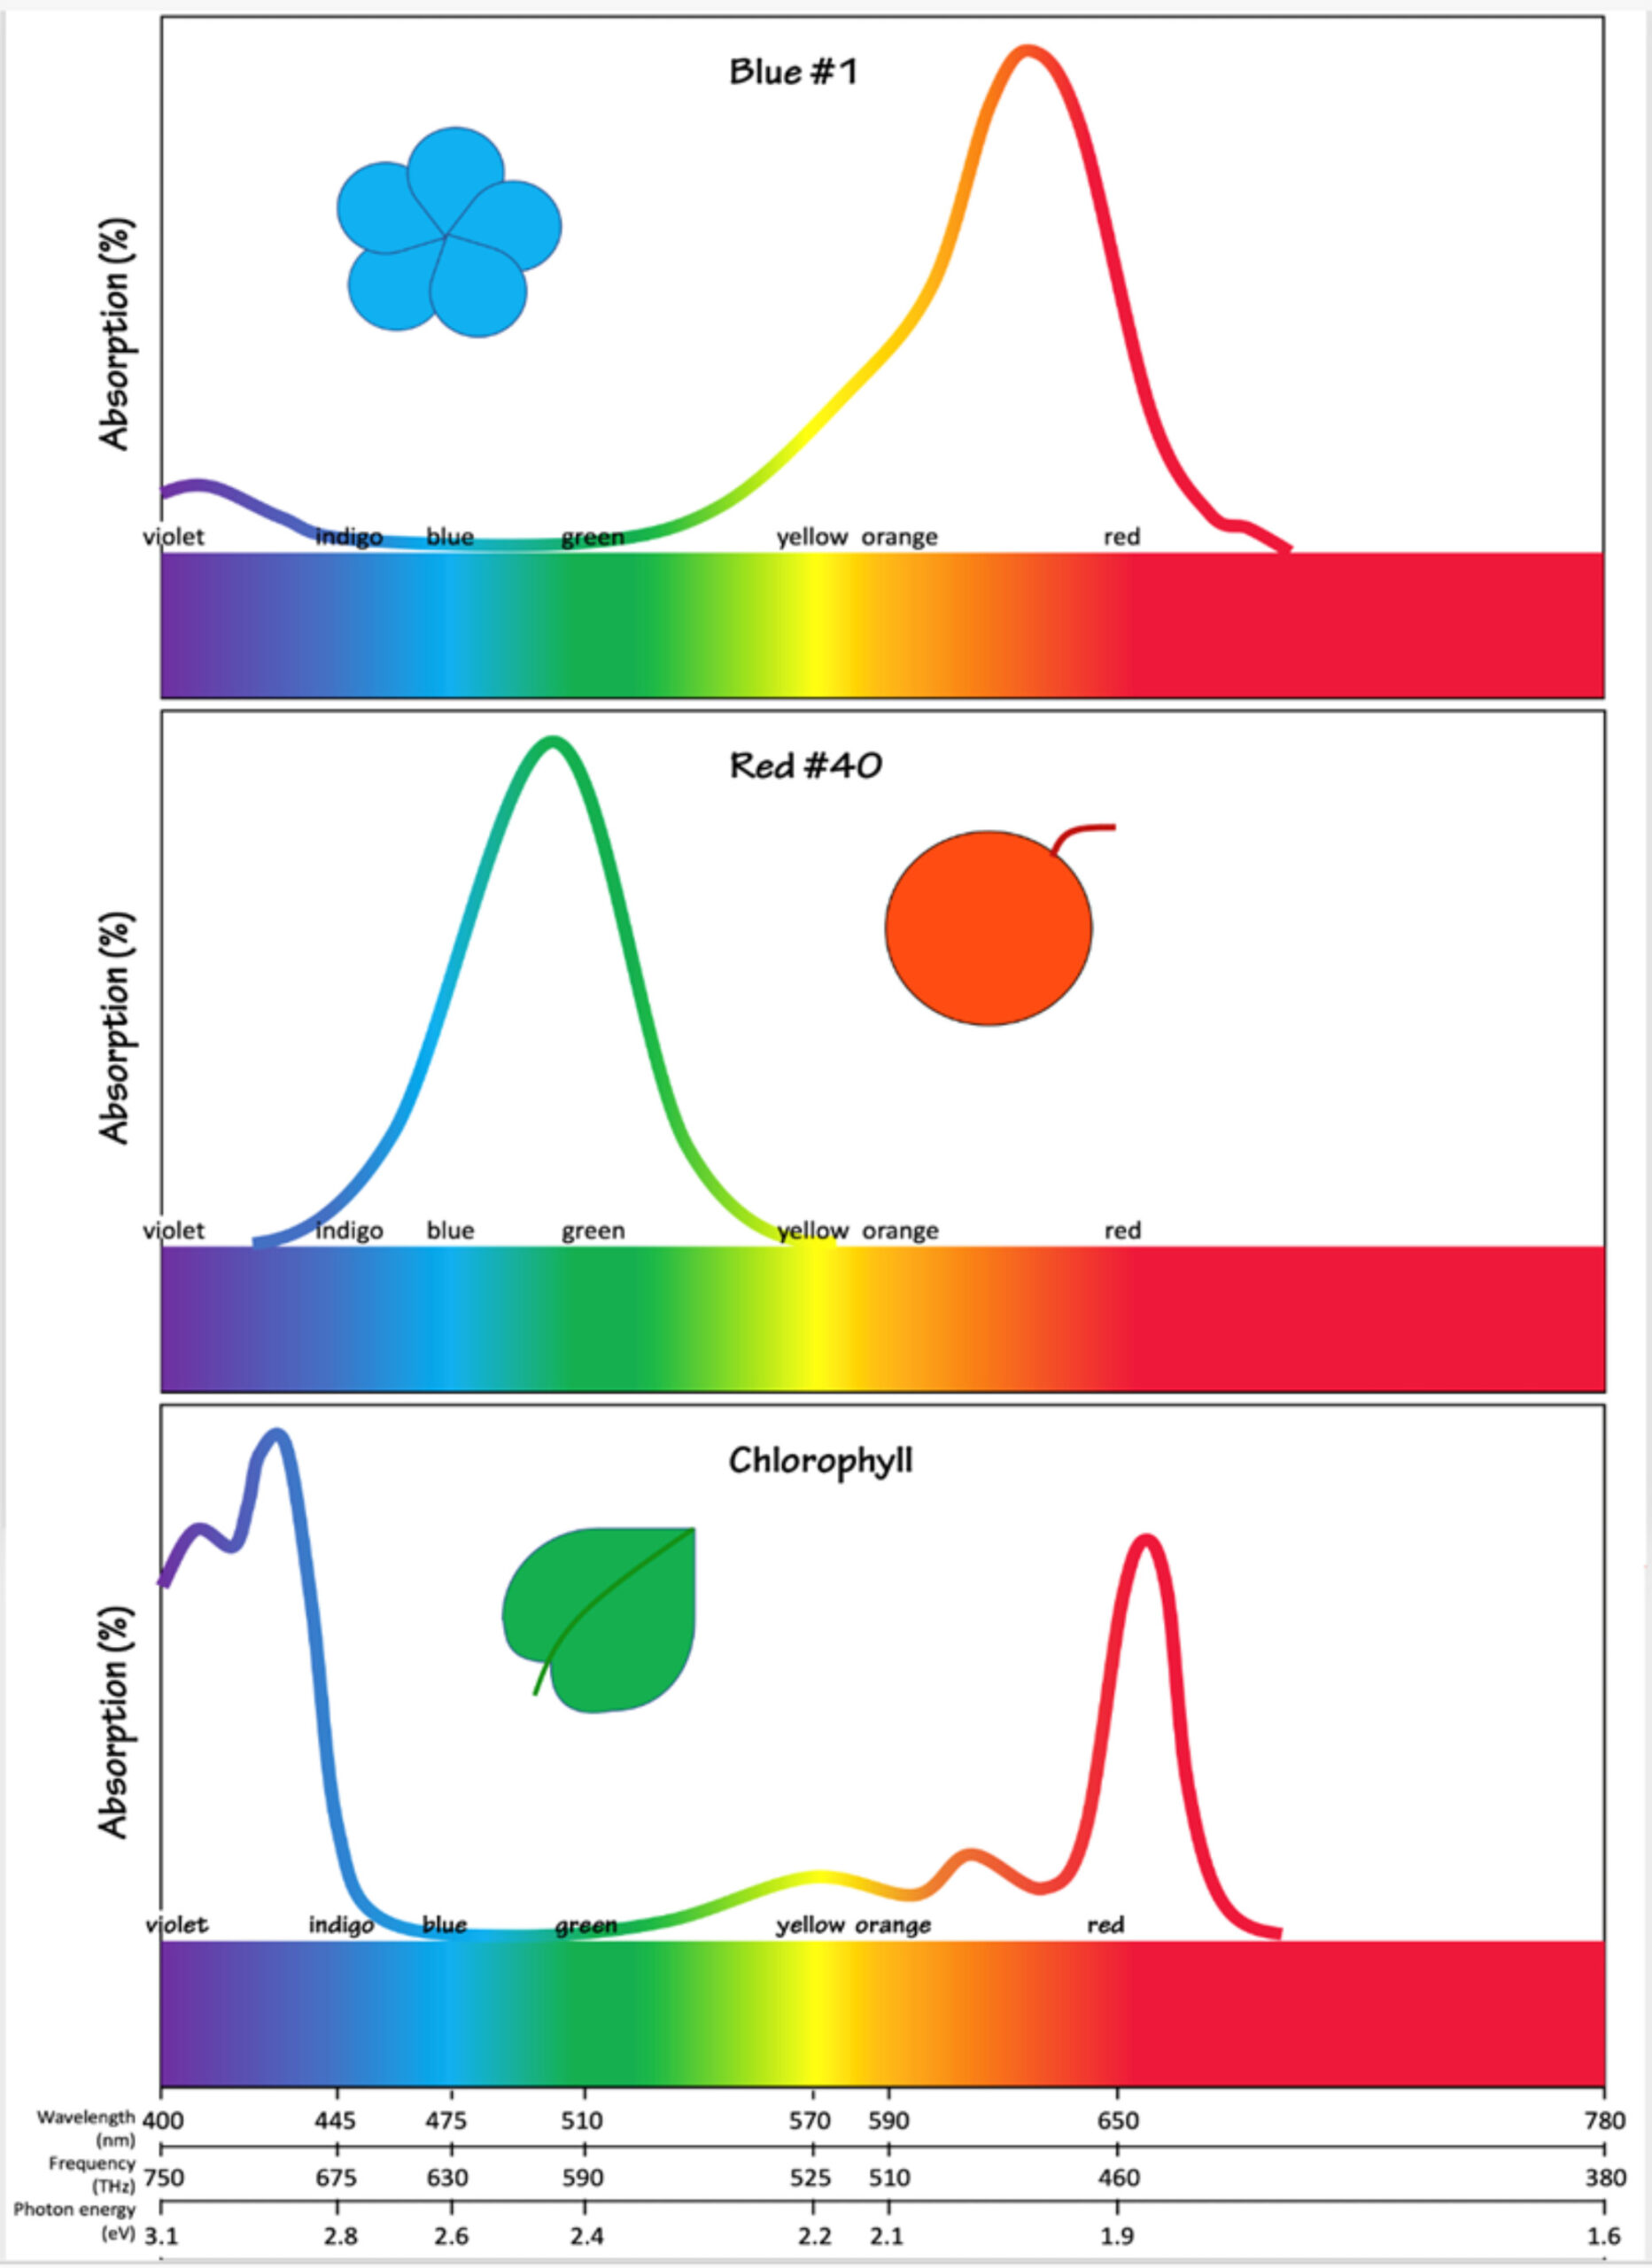
Figure 3: Absorption spectra for three pigments, Blue Dye #1, Red Dye #40, and chlorophyll. Blue #1 absorbs very strongly in the orange and red range of the visible spectrum (peak at 630 nanometers) allowing the blue wavelengths to be transmitted and/or reflected. Red #40 is the opposite, absorbing blue and green wavelengths allowing transmission of red. Chlorophyll is interesting because it has two absorption peaks, at indigo and red, allowing transmission of green wavelengths. Figure by Alexandra Moore for PRI's Earth@Home project (CC BY-NC-SA 4.0 license)
If you have a light meter that detects specific wavelengths you can illustrate the change in transmission intensity of each wavelength with increasing concentration of dye (Figure 4). In the experiment here the intensity at 465 nm continues to increase, while the intensity at 625 nm goes to zero when the dye concentration reaches 200 ppmv. You can also run the experiment with different dye colors, for example, the behavior of the red food coloring Carmine (E120, Natural Red 4) is shown in Figure 5.
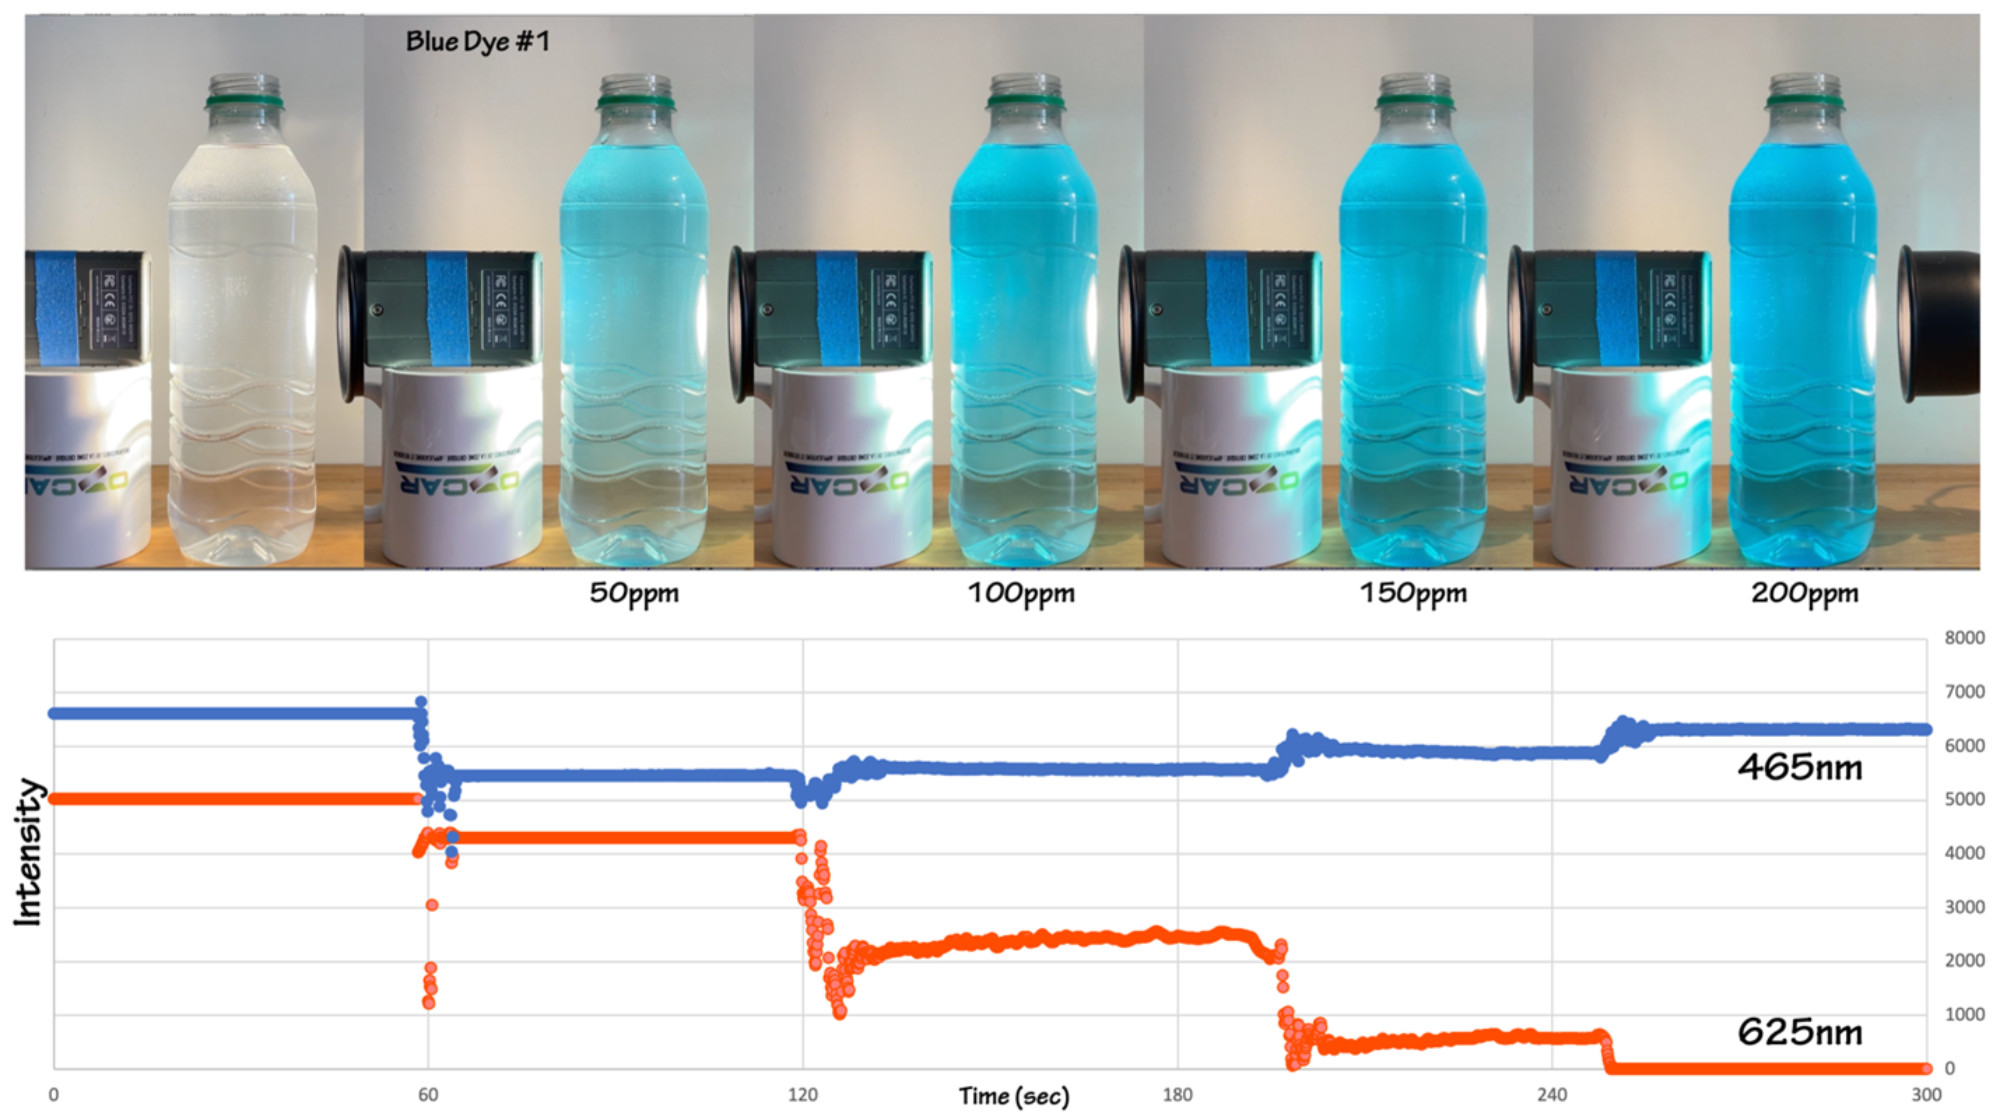
Figure 4: The change in blue light (465 nm) and red light (625 nm) transmission for the same experiment shown in Figures 1 & 2. The transmission at both wavelengths decreases initially when the pure water sample is dyed. With each additional drop of blue dye the transmission (and reflection) of blue light increases and the transmission of red light decreases, with red dropping to zero at a concentration of 200 ppmv. The visual change in color shown in the top half of the figure also shows increasing intensity of the blue color of the solution. Figure by Alexandra Moore for PRI's Earth@Home project (CC BY-NC-SA 4.0 license)
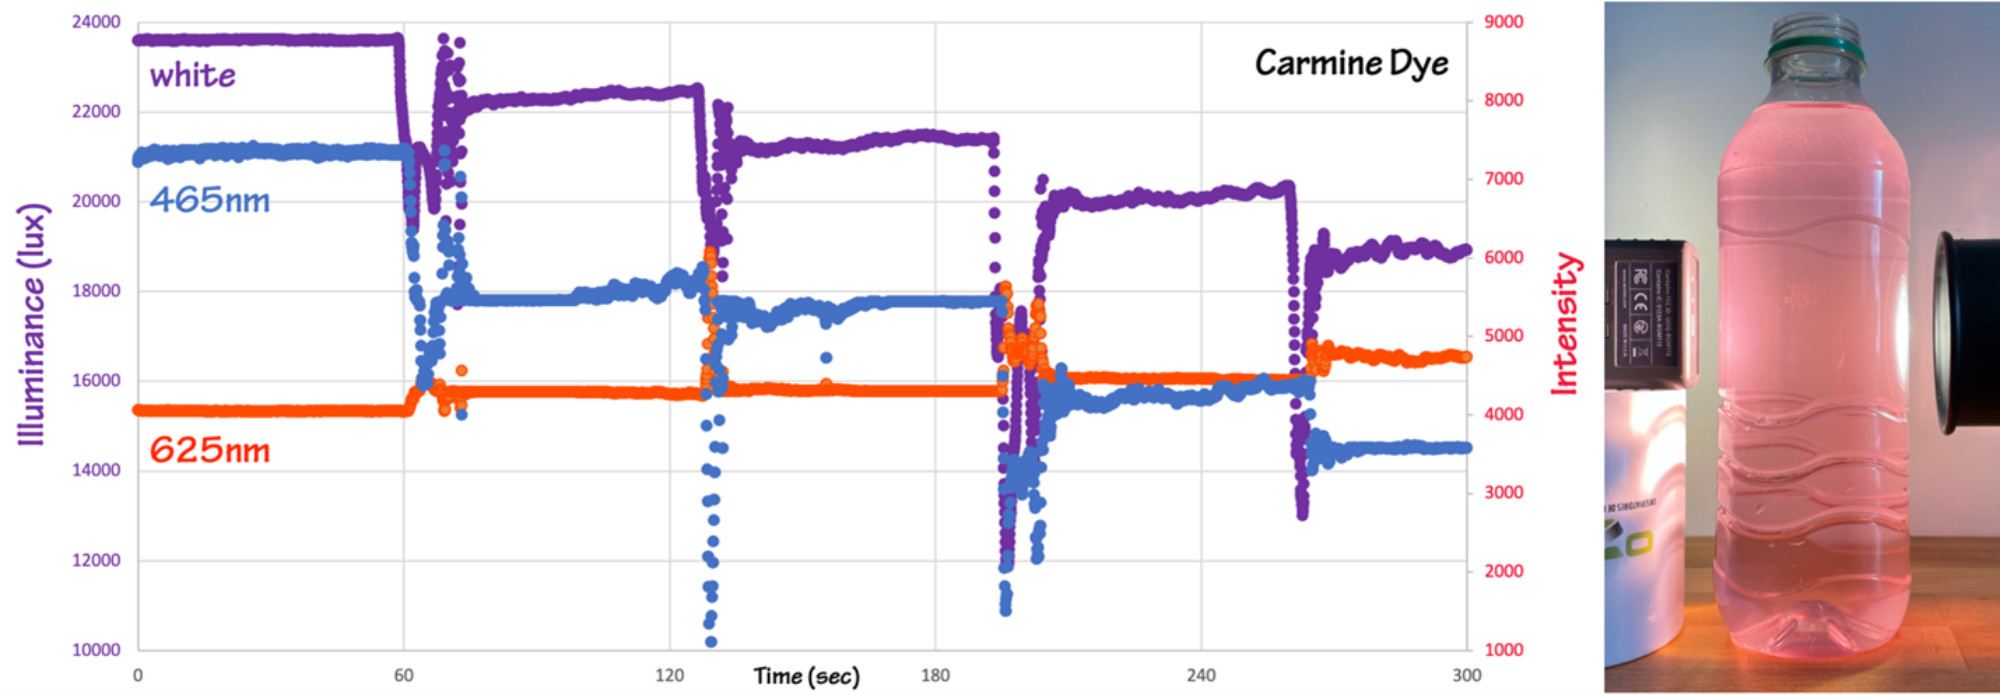
Figure 5: The same experimental set-up run with four drops of red food coloring containing carmine dye. Figure by Alexandra Moore for PRI's Earth@Home project (CC BY-NC-SA 4.0 license)
Tips & Tricks
Blue dye works really well in this experiment; Blue #1 is a vibrant and intense color that shows a large change in both transmitted white light as well as absorption of red light (Figures 2 and 4). Because most one-liter bottles are typically tall and narrow, I chill the dye in the fridge before the experiment to give it a little extra density to help it mix more quickly with the water throughout the bottle (not just at the top where it was added). Ask the students to be careful not to bump the light meter as they mix the liquid, a change in position will change the numerical values that it measures.
You don't need a light meter to run a qualitative version of this experiment. If you can photograph the solution each time you add a drop of dye, as in Figure 2, the photographs will record the change in color. You can also use an inexpensive light meter—such as those sold in garden shops—that detect light intensity and display it on a scale from 1-10. The absorption of light by blue dye is enough to show change on these meters as well.
We tried a free light meter app for a smart phone, but found it to be very fussy, producing noisy data, although there may be more robust options.
Note: The handout that accompanies this activity is written to include a light meter that continuously records data and connects via Bluetooth connection to a phone/computer. If you have different equipment, you can modify the handout as needed.
Take it Beyond the Classroom
The pigments used in dyes selectively absorb specific wavelengths of visible light. This behavior is exactly analogous to the selective absorption of IR wavelengths by greenhouse gases in the atmosphere. When this experiment is placed in the context of climate change it can help illustrate two important concepts:
- The interaction of energy with molecules follows the same physical laws whether we are working with visible wavelengths that we can see, or infrared wavelengths that we cannot see.
- Small concentrations can have important consequences.
The behavior that we see in this experiment is governed by the Beer-Lambert Law, relating the attenuation of light to the properties of the material the light passes through. Specifically, the amount of light absorbed by a sample is directly related to the thickness of sample the light passes through, and the concentration of the sample:
Aλ = ℇλLC
where A = absorbance, L = path length, C = concentration, and ℇ is the constant of proportionality (which has several different names, the extinction or attenuation coefficient, or molar absorptivity; more info here: ChemTalk—Beer-Lambert Law). The subscript λ —wavelength—is included here because absorption is wavelength-specific (ex. Figure 3, above). In our experiment with blue dye both ℇ and L are constant, as we are not changing the material or the size of the container, and the absorbance that we see or measure is determined only by the changing concentration of the dye as we add additional drops. The more concentrated the solution the more light is absorbed (Figure 2). We also see how absorption is very different at different wavelengths (Figure 4).
Figure 2, one more time.
Returning to the absorption spectrum for chlorophyll, and adding the absorption spectrum for carbon dioxide, we can see that the behavior is the same. The only difference is that chlorophyll absorbs visible wavelengths, while CO2 absorbs longer infrared (IR) wavelengths.
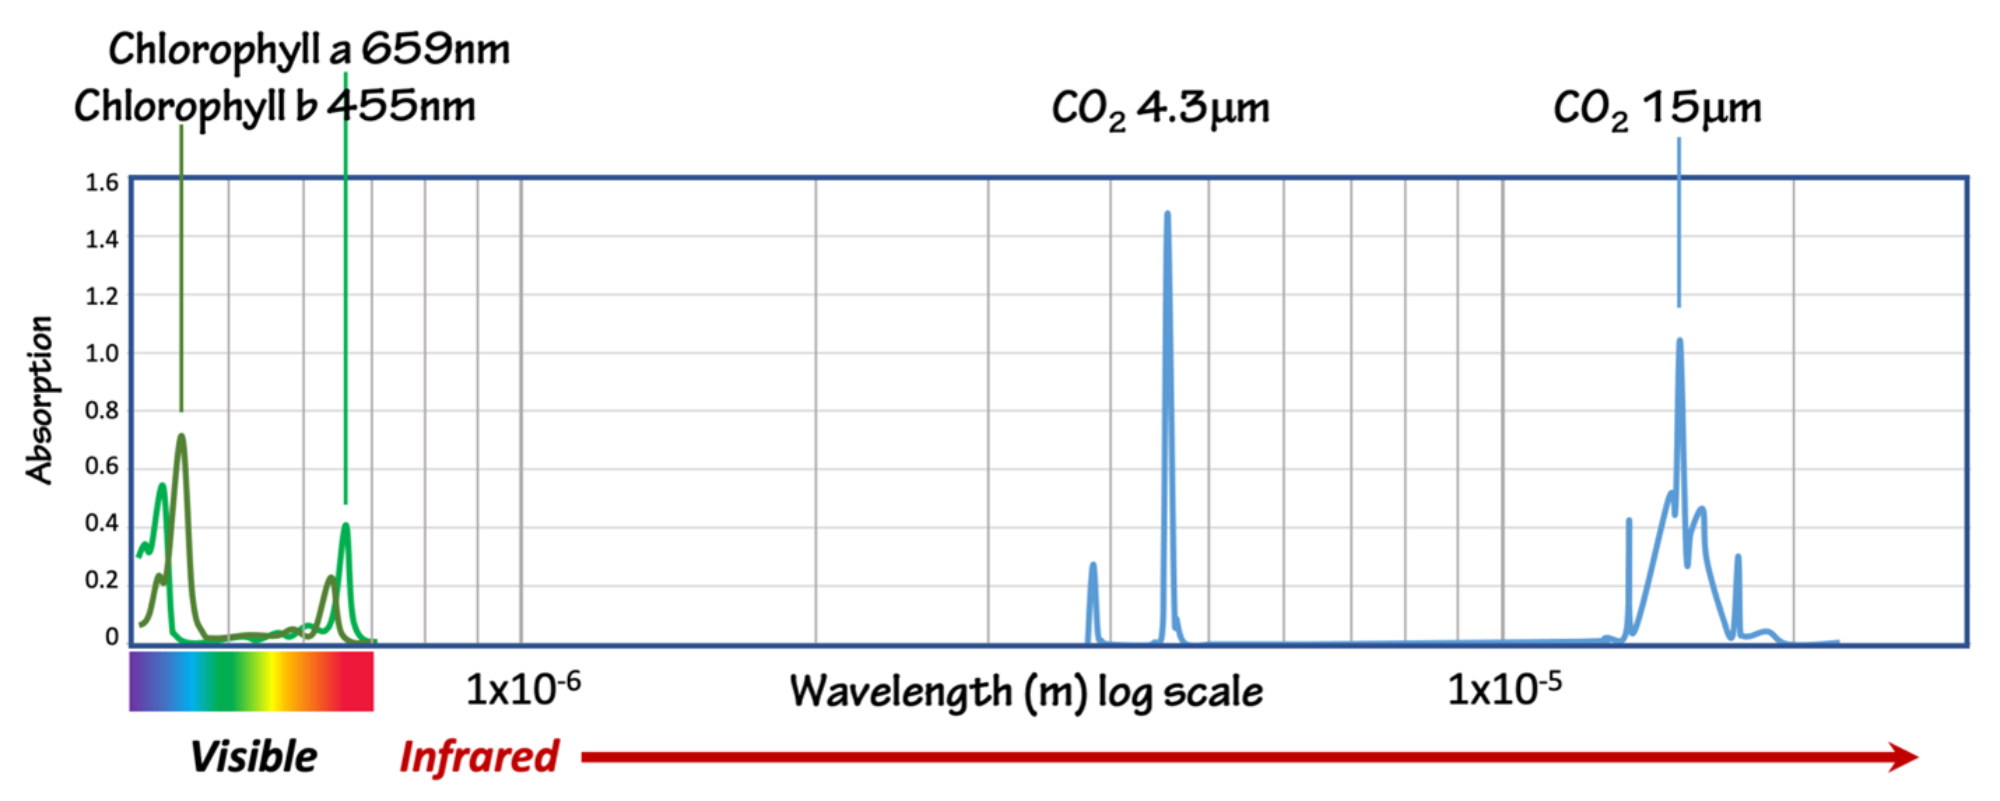
Figure 6: Absorption spectra for chlorophyll and carbon dioxide (Spectra from NIST and NASA; The NIST webbook has an interactive spectrum that allows you to toggle between absorbance and transmittance, showing the relationship between the two. Figure by Alexandra Moore for PRI's Earth@Home project (CC BY-NC-SA 4.0 license)
Since Earth's atmosphere contains 420 ppmv CO2, this suggests that we should expect to see a decrease in some wavelengths of IR energy that pass through the atmosphere. Satellites that observe IR energy emitted by Earth's surface show exactly that (Figure 7).
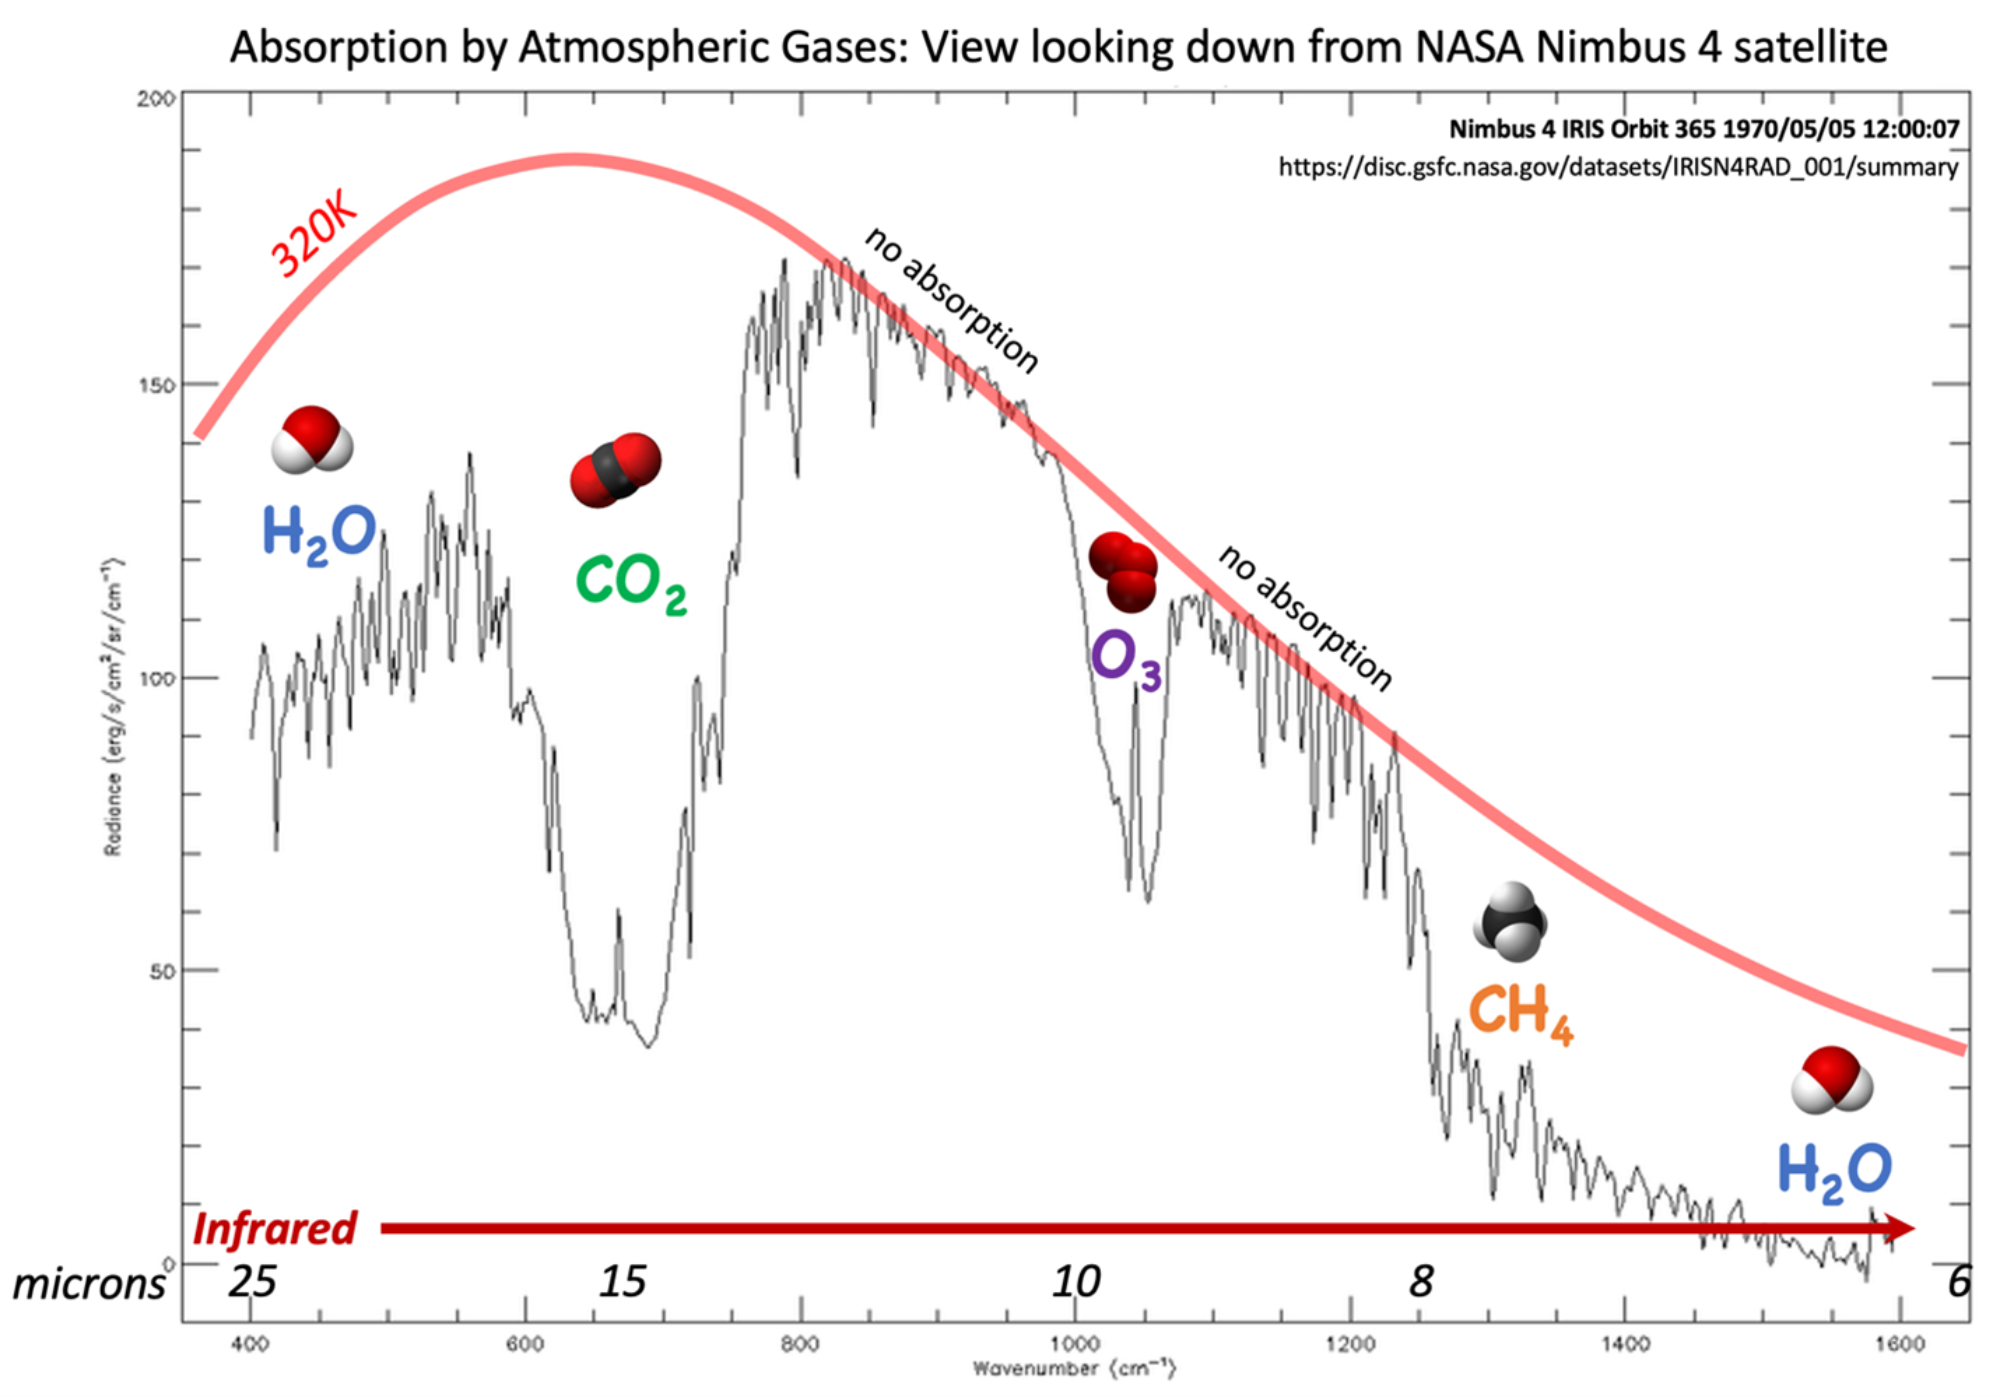
Figure 7: Infrared spectrum of energy radiated from the Earth, viewed from above the atmosphere by the NASA Nimbus4 satellite. The smooth red curve is the idealized radiation that the satellite would "see" in the absence of any atmosphere. The black line is the observed radiance. Trace gases in the atmosphere are strong absorbers at specific IR wavelengths. The absorption of energy at 15 μm by carbon dioxide is the reason that CO2 is the greenhouse gas of greatest concern. Figure by Alexandra Moore for PRI's Earth@Home project (CC BY-NC-SA 4.0 license)
We can set up an IR experiment that is analogous to the visible experiment here. These two activities, completed sequentially, allow students to progress from absorption that they can see, to absorption that they cannot see. The IR experiment can be found here: LINK COMING SOON.