
Overview
We observe thermal expansion every time we use a simple liquid-filled thermometer. Changing the temperature of a material changes its density and thus its volume. In a thermometer this forces the liquid to expand into a narrow tube, which is calibrated to show us the temperature. The same property applies to larger systems—like the water in the ocean—and is one of the principal concerns of climate change. There is a coefficient of thermal expansion that is unique to each material that determines how much the material will change volume when heated. In this activity we calculate the coefficient of thermal expansion for tap water.
Introduction
Students will heat water in a long-necked glass bottle to explore the relationship between temperature and volume of water. Quantifying the initial volume, change in volume, and the initial and final temperatures allows students to calculate the coefficient of thermal expansion for tap water.
Grade Level
6-8, 9-12, 13-14
This activity can be completed by students from grades 8-14. The calculation requires the use of intro-level algebra, although younger students can perform the experiment non-quantitatively.
Learning Objectives
Students will
-
set up and conduct a quantitative experiment
-
measure and record changes in a simple system
-
use algebraic manipulation of their own data to calculate the coefficient of thermal expansion for water
-
explore the relationship between temperature and volume changes in a liquid, and apply their experimental results to real-world systems
Lesson Format
In School: This is a lab activity. Ideally students will work in small groups – although if the availability of equipment constrains group size, the experiment can be done as a class demonstration.
Virtual Lab: With access to a few basic tools this activity can be done in a remote learning environment using a YouTube video for guidance.
Time Required
This activity requires one or two lab periods; the experiment itself will take one period, while discussion and analysis will require an additional class period.
Standards
NGSS:
Planning and Carrying Out Investigation
Analyzing and Interpreting Data
PS1.A: Structure & Properties of Matter
ESS3.C: Human Impacts on Earth Systems
ESS3.D: Global Climate Change
Scale, Proportion & Quantity
Energy & Matter
Credits & Contact Info
Dr. Alexandra Moore
Paleontological Research Institution, 1259 Trumansburg Rd., Ithaca NY 14850
moore@priweb.org
Instructions & Materials
Resources
-
Instructor Handout (pdf, 14.6 MB)
-
Student Handout (pdf, 6.5 MB)
-
Video: In the Greenhouse #6 | Thermal Expansion & Sea Level Rise
In-School Activity
-
Download the Instructor Handout & Student Handout.
The Instructor Handout duplicates all the content of the Student Handout, with additional context and directions for setting up and running the experiment.
-
Set up and run the experiment yourself first, to gauge the range of behavior your students are likely to encounter. If you are limited by time or equipment – for example not enough hot plates for students to work in small groups, or short class periods – you can have one experimental set-up (saving time if you’ve set it up ahead) and have each team work independently with the group data. Decide what type of additional activities (if any) you would like the class to pursue.
Materials (duplicate this list for each student group)
-
Hot plate, stove top, or similar, to heat a pan of water
-
Long-necked bottle (ex: soda, wine)
-
Graduated cylinder/beaker/measuring cup, to measure volume of water in bottle
-
Small grad cylinder/beaker/measuring cup to measure volume change
-
Large beaker or sauce pan, to keep bottle from direct contact with stove/hot plate
-
Thermometer – metal-stem digital kitchen thermometer or digital aquarium thermometer
-
Masking tape
-
Calculator or computer spread sheet
Instructions
This experiment asks students to heat water in a bottle, a process that forces the warm water to expand into the bottle neck. Students measure the temperature change and volume change of the water, and use these values to calculate the coefficient of thermal expansion for tap water at room temperature. Once students have gained this expertise they can apply their knowledge to larger and more important systems; notably the projected sea level rise due to warming of the global oceans.
When a material is heated, its change in volume is proportional to the amount of material present and to the change in temperature. That idea can be expressed mathematically:

Here the constant of proportionality is the coefficient of thermal expansion, commonly designated with the Greek letter β (sometimes α), and with units of K⁻¹, or “per degree.” The initial volume is designated V₀, the volume change is ΔV, and the temperature change is ΔT.
[Note: this is a nice example that supports math literacy in that the verbal description of the concept translates directly word-for-word to the mathematical expression.]The step-by-step instructions for setting up the experiment are given in the teacher and student handouts.
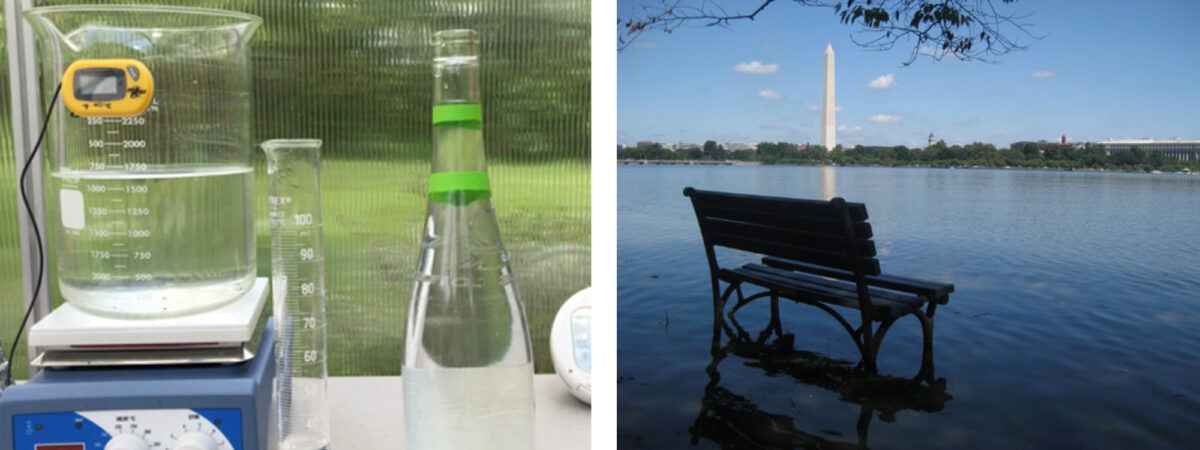
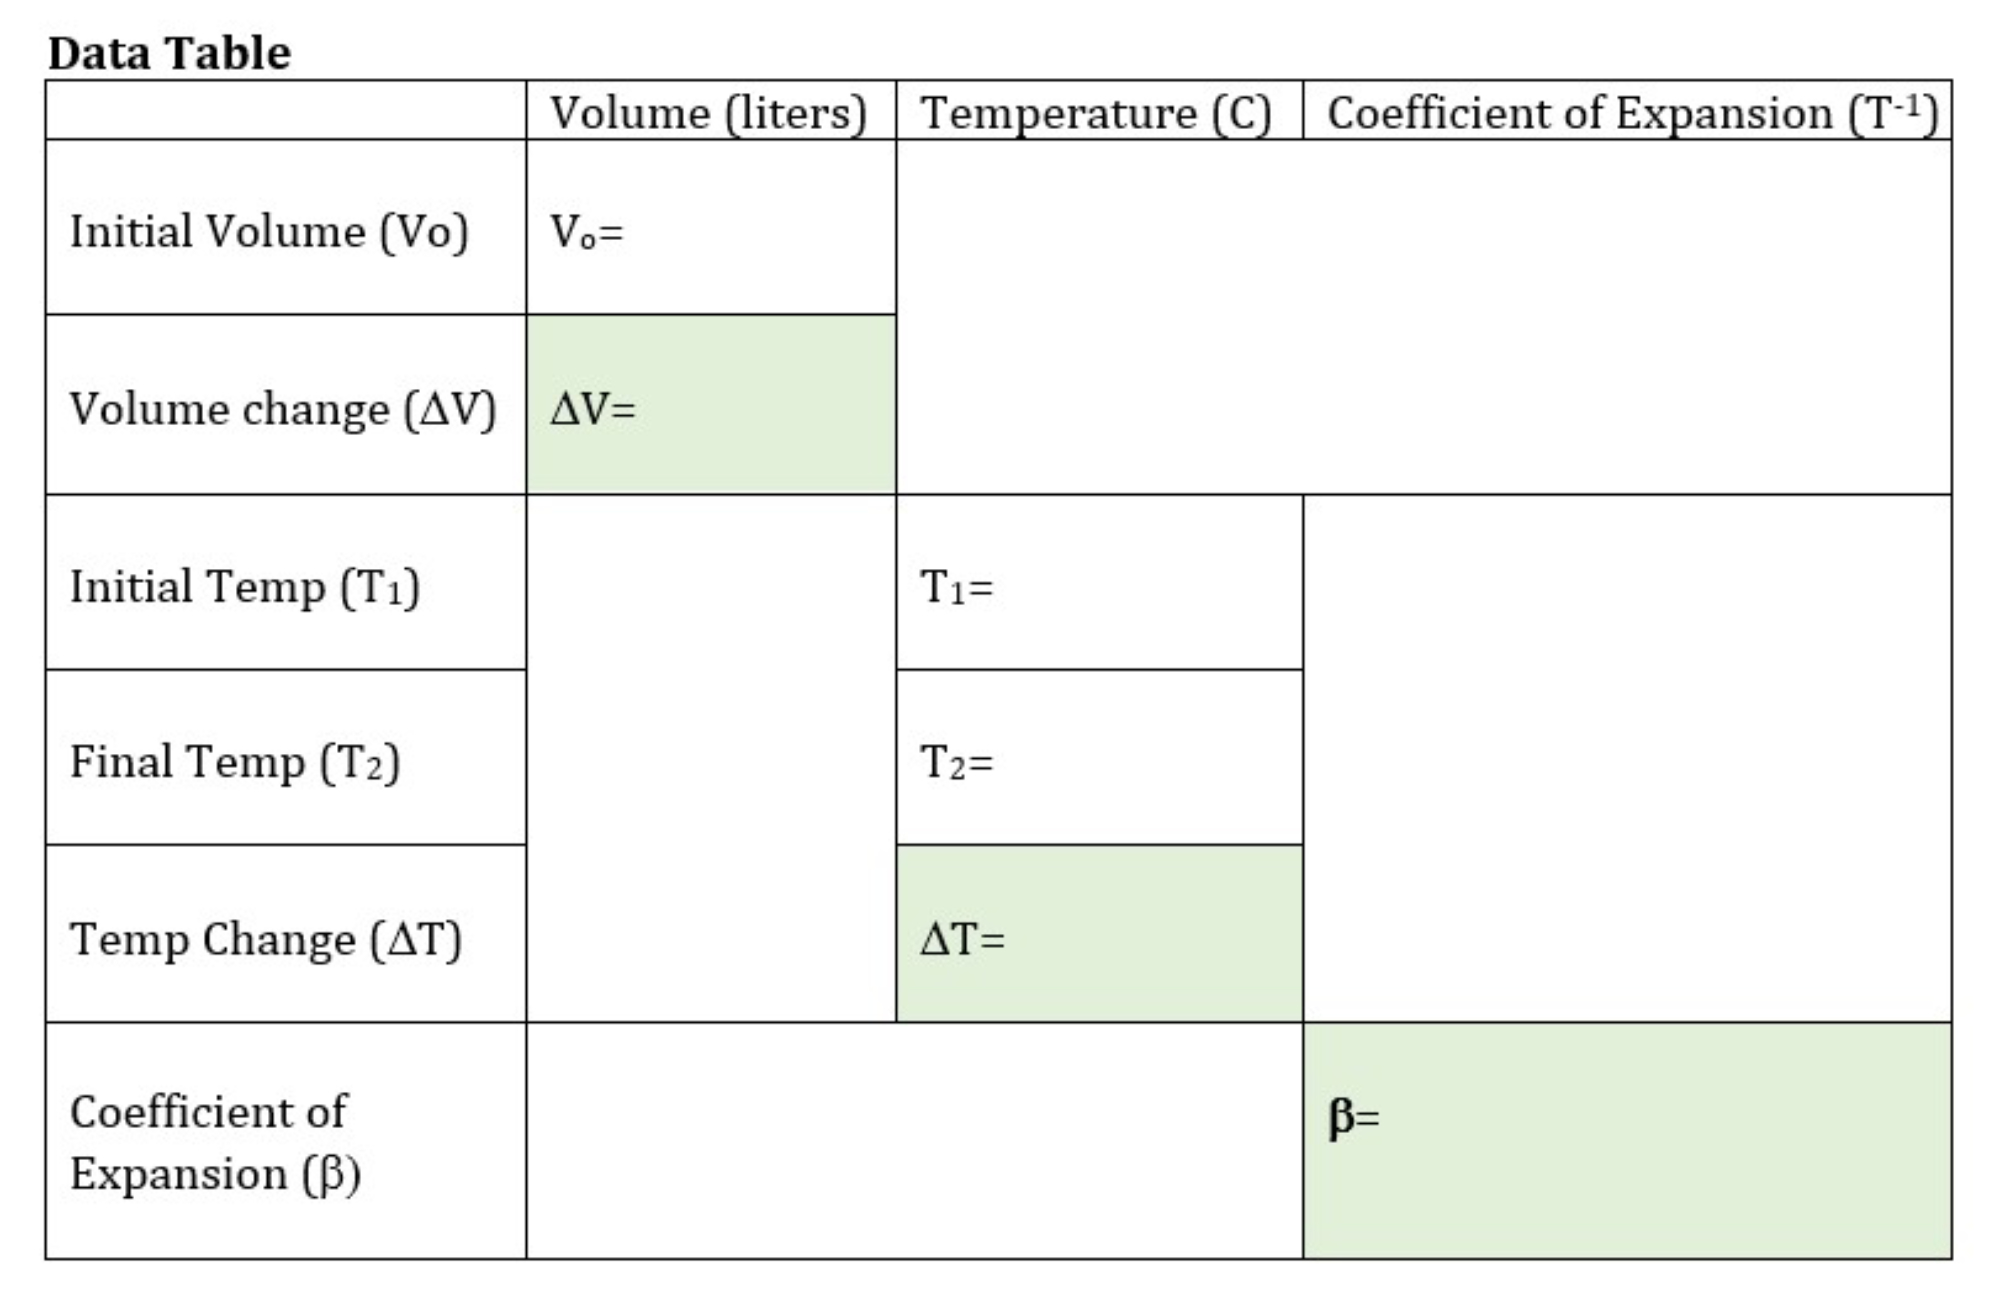
Students will add a known volume of water to the long-necked bottle—enough to bring the water level to the bottom of the narrow neck. A thermometer is inserted into the bottle, and students mark the initial water level on the bottle and record the initial temperature. The bottle is placed in a larger heat-resistant water-filled container (to keep the bottle from direct contact with the heating element and prevent breakage) and the entire system is heated through a temperature change of ca. 40°C (this will take approximately 10-20 minutes, depending on the power of the heating element). Students record the final temperature and remove the bottle from the water bath to mark the final volume on the bottle neck. At this point students will design a protocol for measuring the change in volume. Since they began with cold/room temperature water they will need to re-measure the new volume with water at the initial temperature, not the final warmer temperature. One method is to empty the warm water and re-fill the bottle to the new volume mark with cold water, then pour the new volume of water into a beaker/graduated cylinder, subtract the new volume from the initial volume to find the volume change. Data can be recorded on a table like the one below. Note that the boxes with green shading are those that require a calculation whereas unshaded boxes are direct measurements.
Solution
The coefficient of thermal expansion for water in this experiment should be β~0.0004/°C.
Background & Extensions
Overview
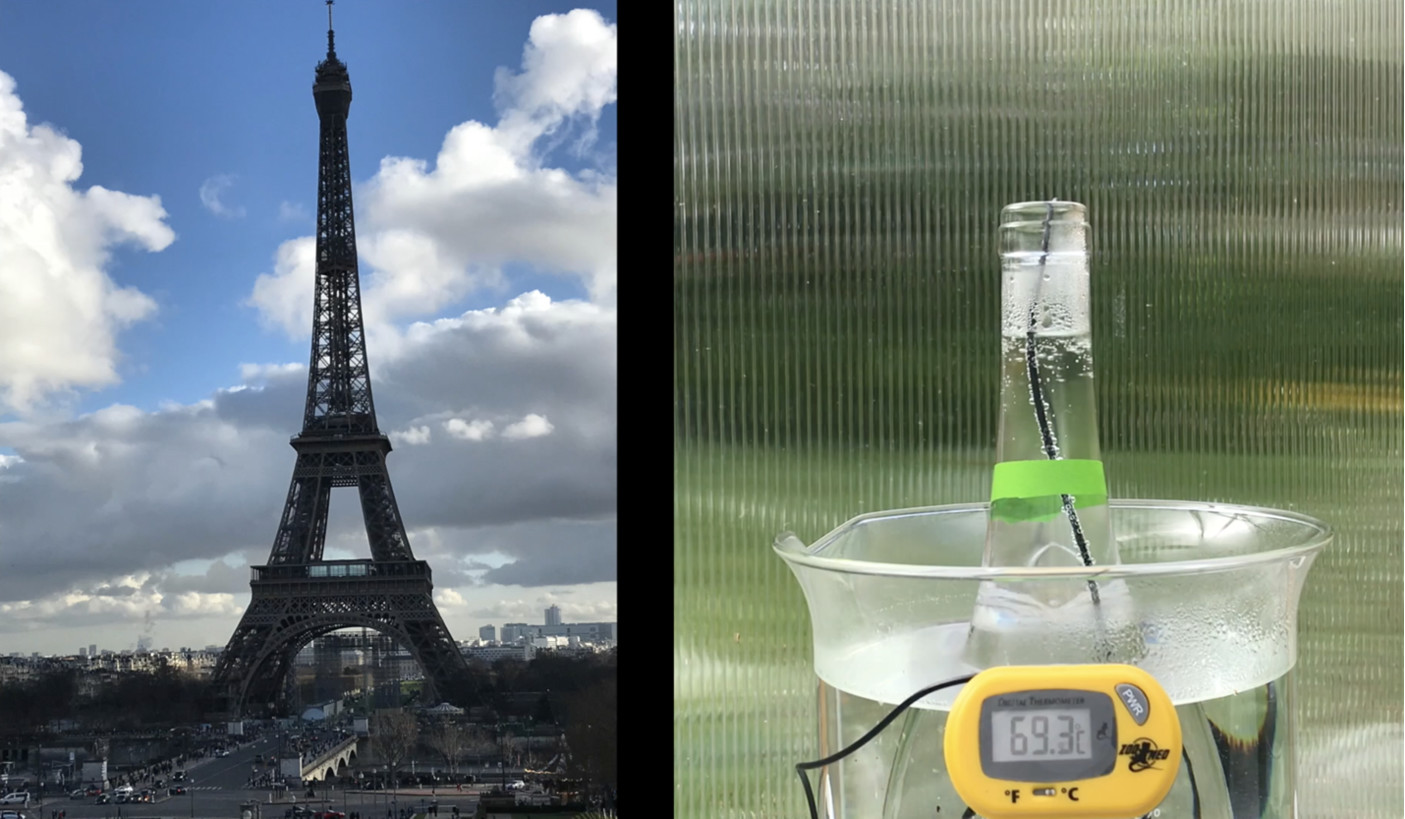
The coefficient of thermal expansion is not a universal constant. It varies as a function of the materials that we might examine, and for each material the coefficient varies as a function of the ambient temperature and pressure. For example, the coefficient of thermal expansion of the iron in the Eiffel Tower is different from that of fresh water, and the coefficient of thermal expansion is different for fresh water and for salt water.
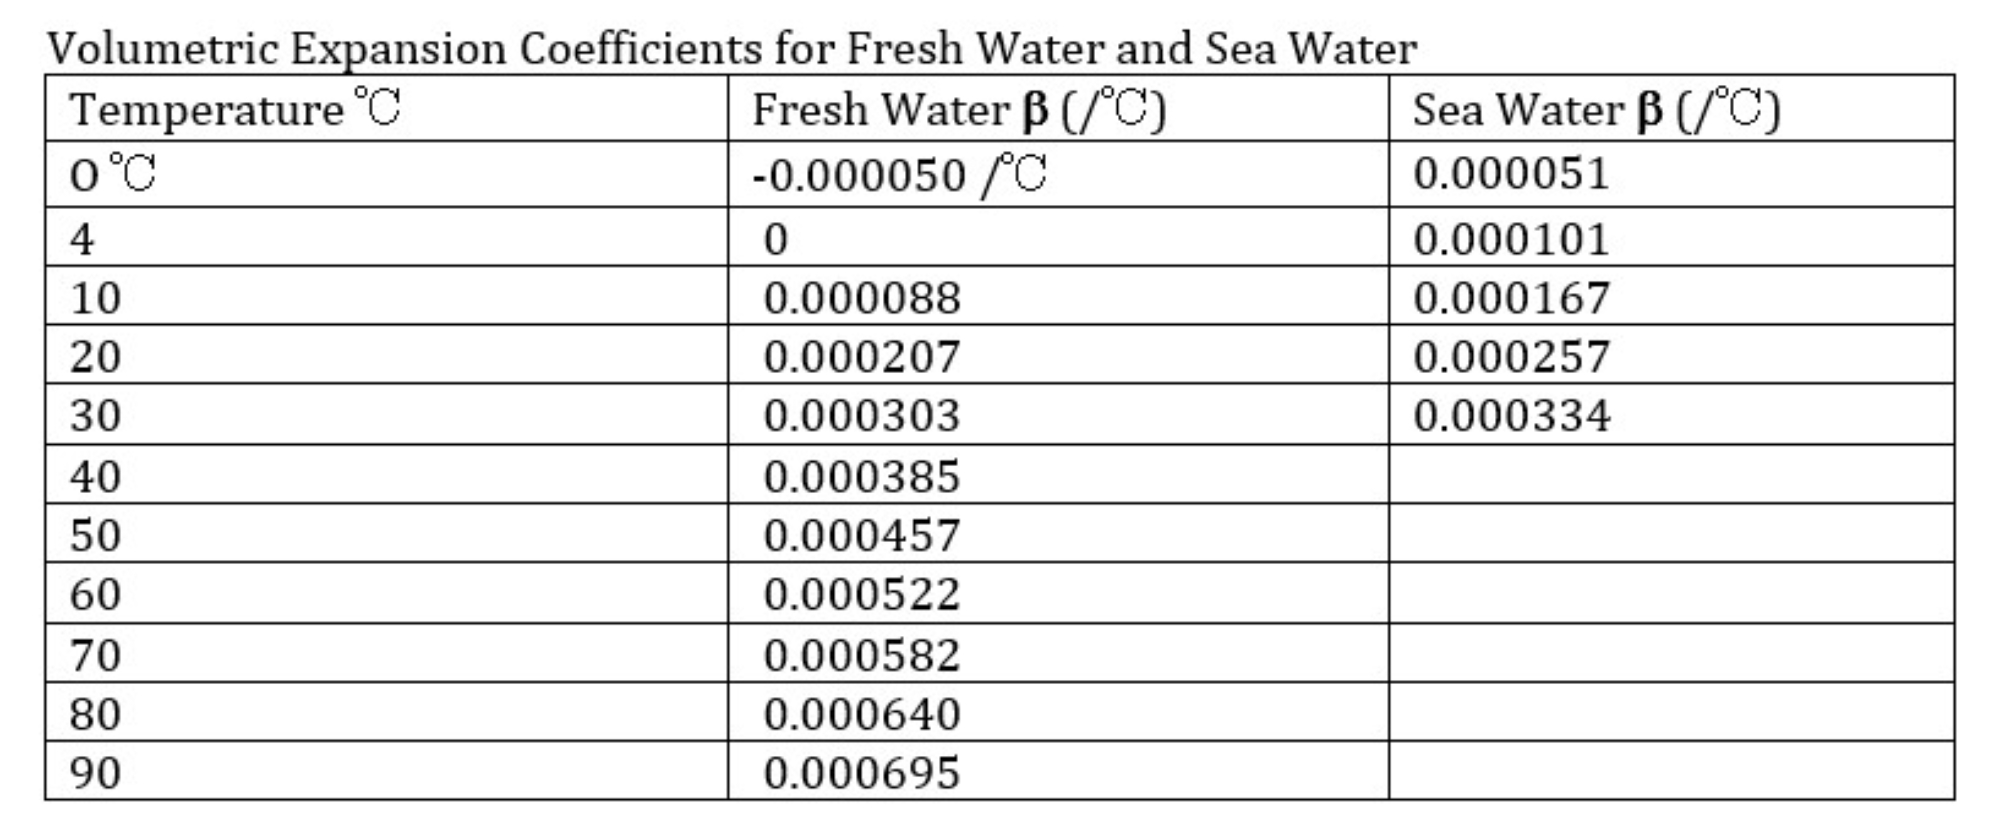
The temperature variation for the volumetric coefficient of expansion for fresh water and sea water is shown in the table below:
Clearly thermal expansion is a sensitive parameter—and it might seem like a messy quantity to introduce to students—but it is also a critically important one. And because it is so important, materials scientists and engineers have worked for centuries to figure out expansion coefficients for every possible material in every possible environment; thus these are quantities that we know very well. A walk across any bridge should reveal the expansion joints engineered into the construction to accommodate seasonal and diurnal temperature changes, and the expansion gaps between the steel rails on a railroad track give rise to the characteristic “clickety-clack” sound of moving trains. Thermal expansion in the built environment is all around us, even if we don’t think a lot about it.
Thermal expansion in the natural environment is equally important, and in the 21st century the thermal expansion of sea water is a parameter that will impact millions of people globally. More on that below.
Tips & Tricks
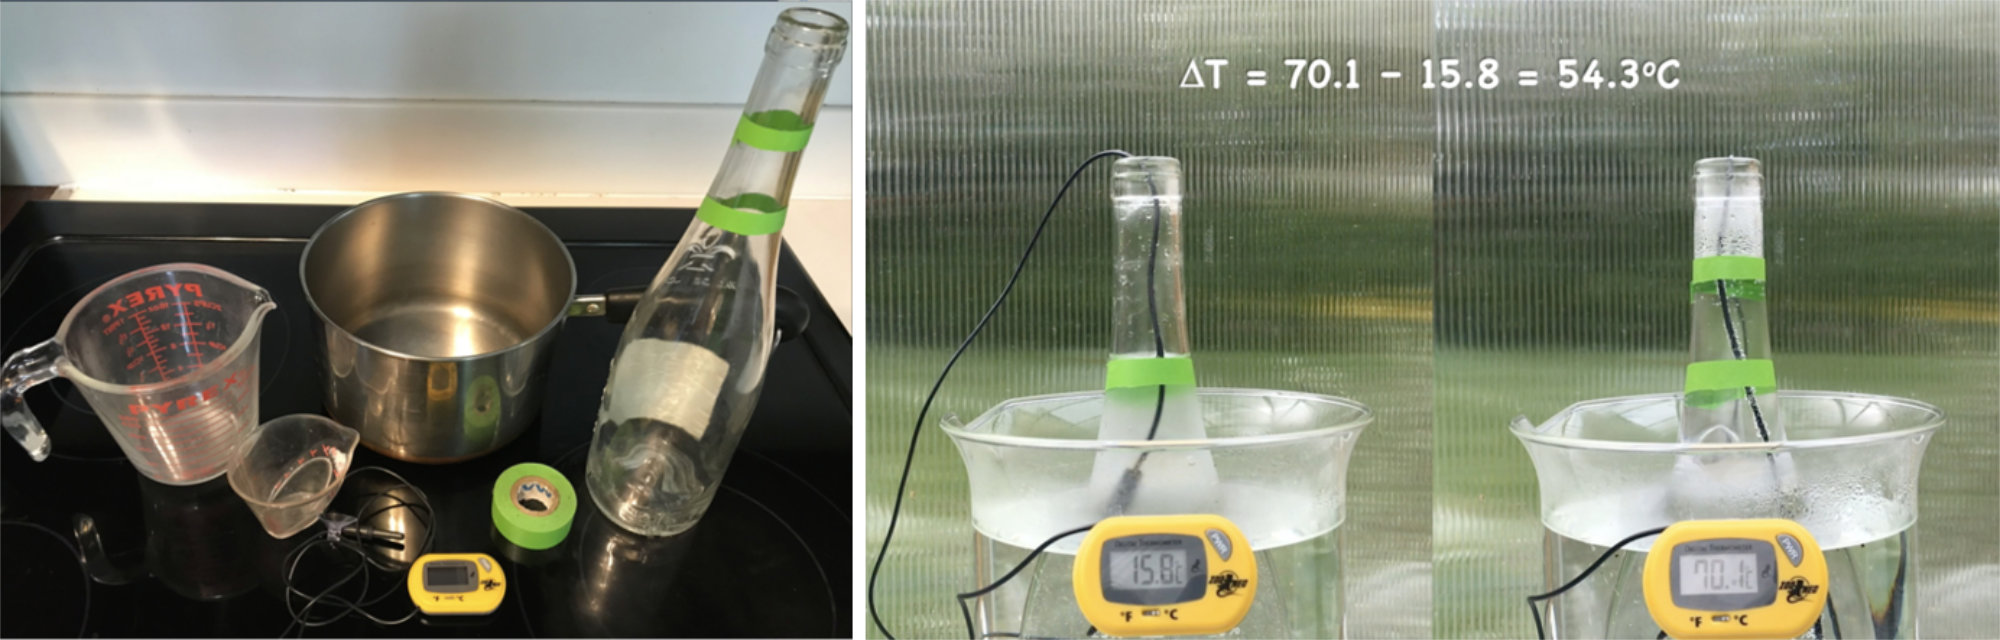
Safety first. In the video I heated the water to 70°C, which is scalding hot. The experiment will work just as well at lower temperatures. 50°C = 120°F, which is a safer temperature for inattentive students. Since both the temperature change and the initial volume of the water determine the amount of volume change, using a larger bottle—a wine bottle as opposed to a soda bottle—will produce a larger and more visible increase in volume, especially if you choose to heat the water less.
A digital thermometer is always easier to read than an analog thermometer. In this experiment the thermometer itself takes up some of the volume of the bottle, so it is important to make sure that the initial volume and final volume are recorded under the same conditions – either with the thermometer in, or out, of the bottle. An aquarium thermometer is ideal for this experiment as it is easy to use with the bottle and has a big easily-read display.
To calculate the coefficient of thermal expansion from the equation given here requires a simple algebraic manipulation. For students who do not have this background the equation can be re-arranged ahead. If students wish to compare their result with published values for the coefficient of thermal expansion they will need to consider the temperature range over which they heated the water, since β changes as a function of temperature. For example, if the water was heated from 20 to 60°C, the appropriate temperature to compare to is the midpoint of that range, 40°C, where β=0.000385.
One final consideration; engineers tabulate the coefficients of thermal expansion for both volume expansion and linear expansion (ex: a piece of steel re-bar experiences mostly linear expansion). In this instance we are measuring the volumetric expansion of water, even though we will think about consequences such as sea level rise, which is a linear measurement. More below.
Take it Beyond the Classroom
In this experiment we use a very small volume of water and heat it over a very large temperature range. In the natural world it is more common for a large volume of water to be heated over a very small temperature range. The goal of this experiment is to give students experience with the concept of thermal expansion so that they can consider systems that are beyond their ability to measure directly. The most important such system is the change in volume of ocean water in response to changes in global temperature.
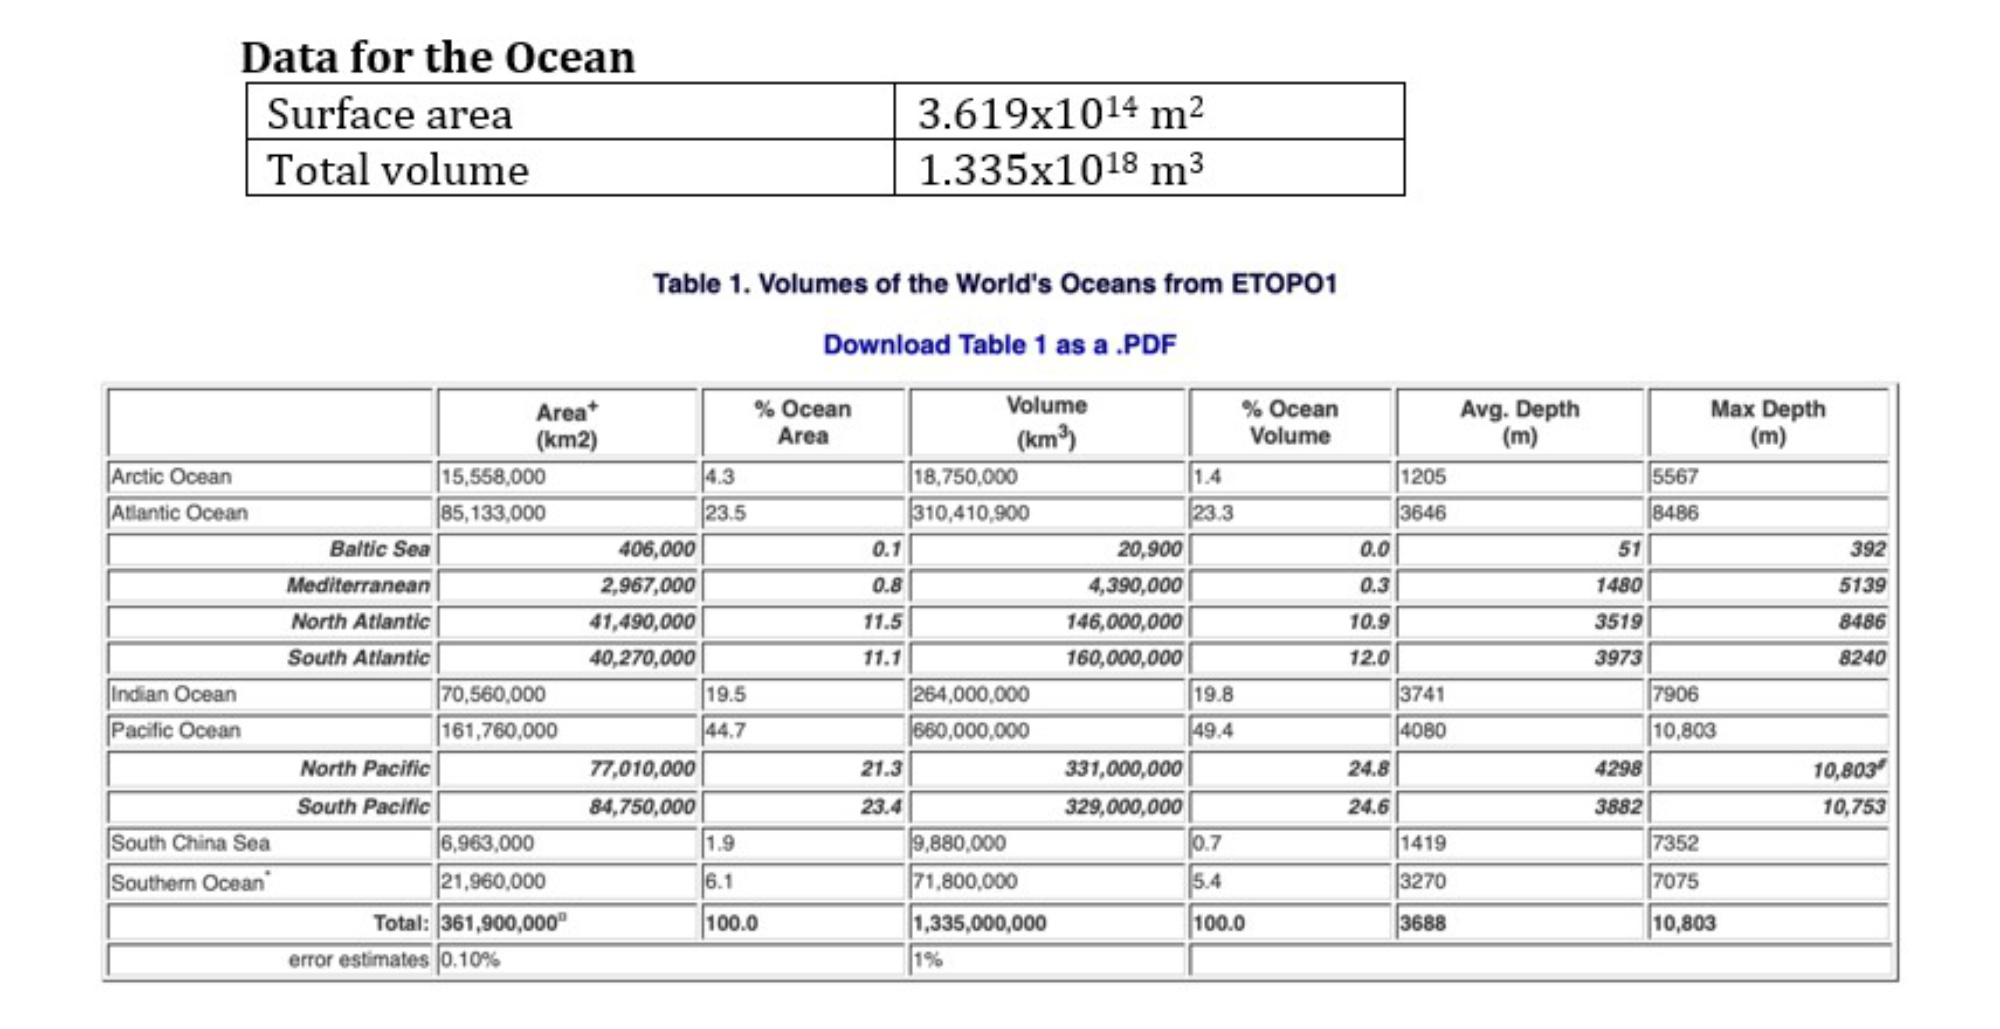
In its 2021 Assessment Report (IPCC AR6) the Intergovernmental Panel on Climate Change presented five climate change scenarios, each based on a range of assumptions about anthropogenic greenhouse gas emissions over the next century. The scenarios range from very-low and low emissions through intermediate, high, and very high emissions. Each set of greenhouse gas emissions drives a temperature increase and subsequent sea level increase (along with other outcomes not discussed here, but which can be found in the AR6 Report.
We can select representative temperature increases for sea water and use an appropriate coefficient of thermal expansion for the ocean to calculate the contribution to sea level rise from the thermal expansion of sea water. The calculation for a 0.2°C increase in the temperature of the ocean is shown in the figure below.
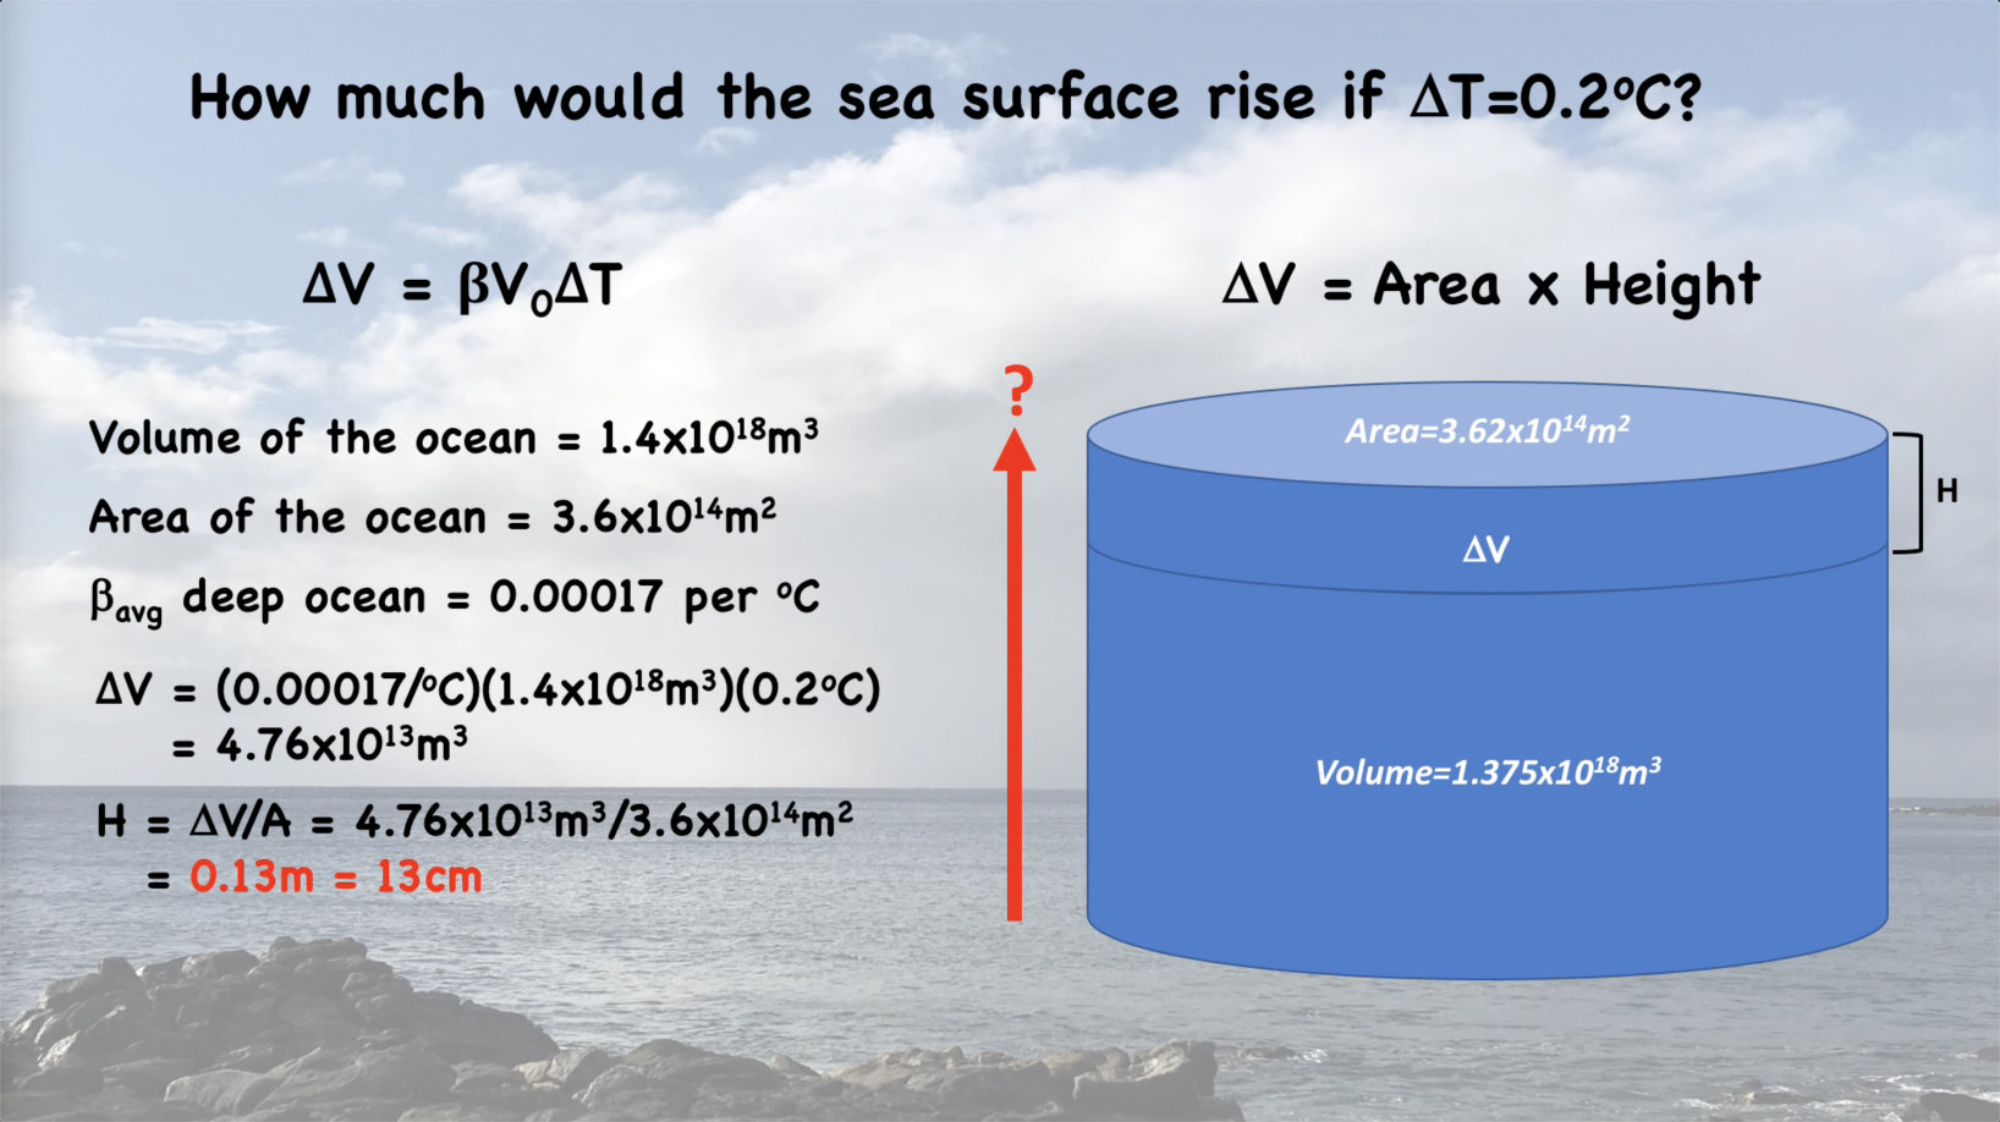
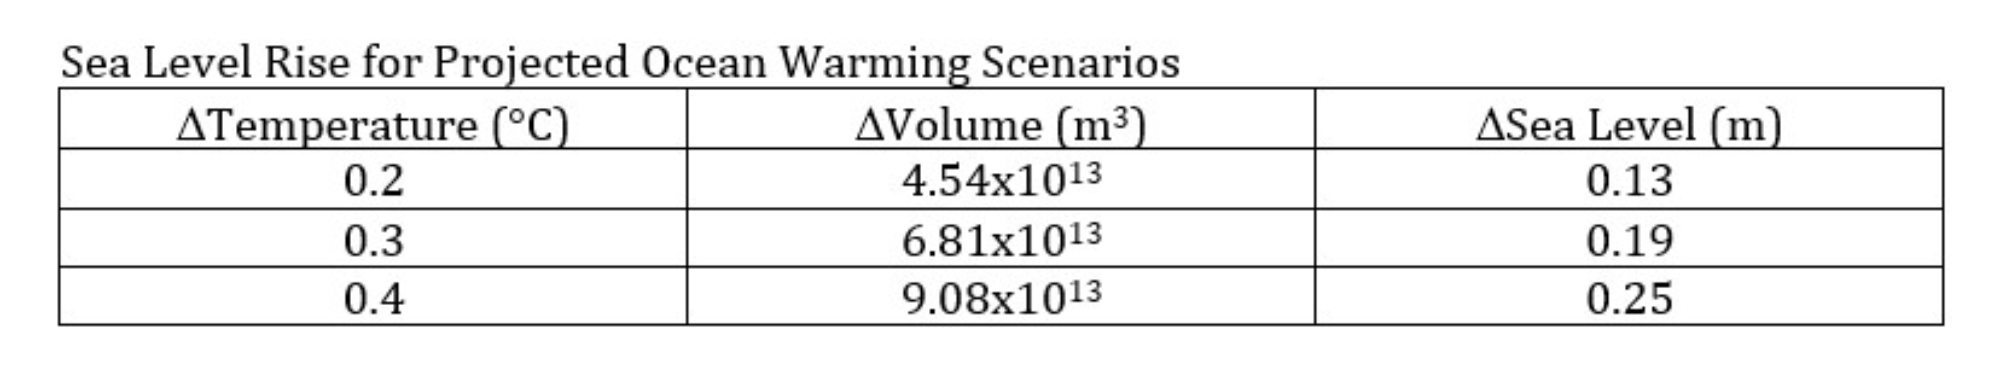
Figure: Results of three emissions scenarios from the IPCC Special Report on the Ocean and Cryosphere in a Changing Climate
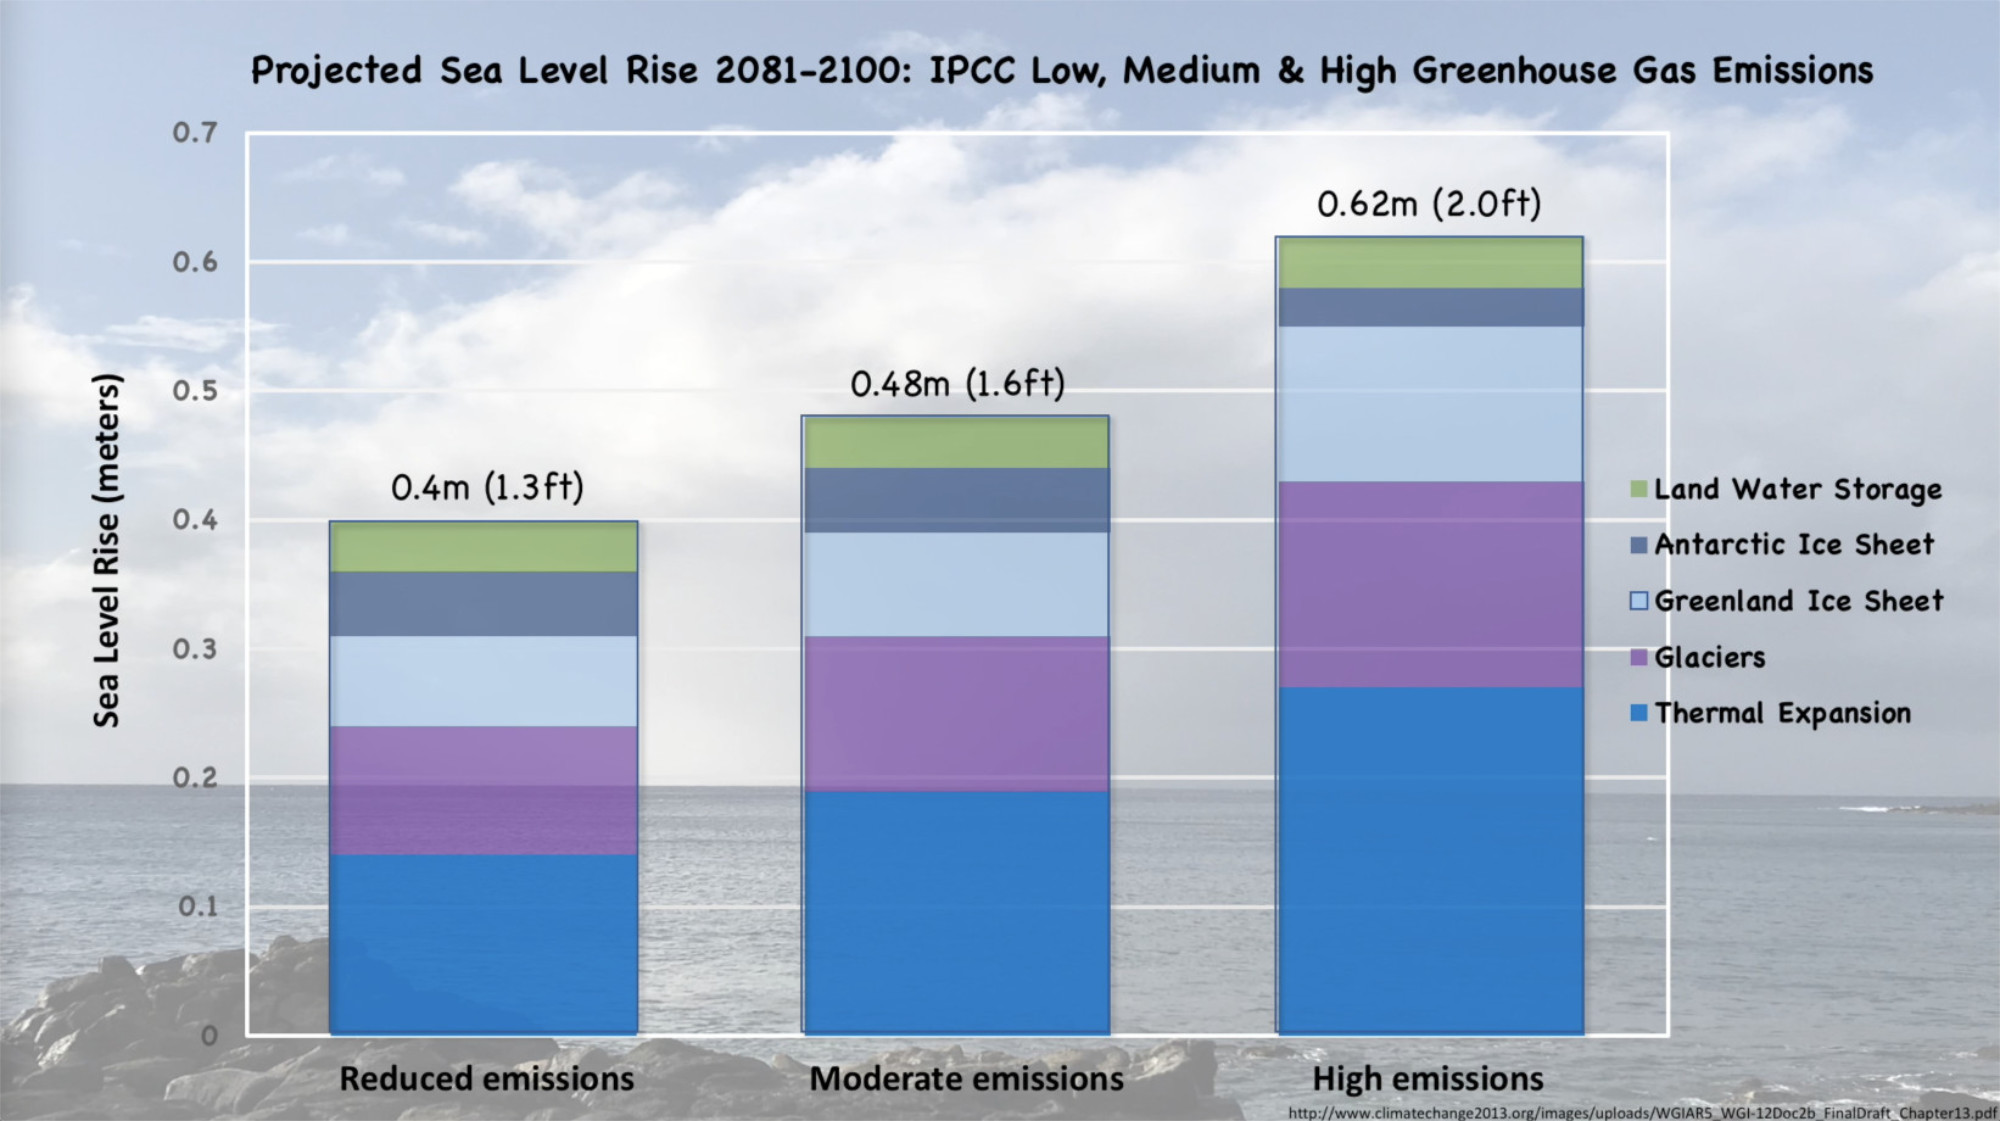
Why does this matter? The sea level rise projections might appear to be small, but they are in fact significant, for several reasons:
-
Low-lying coastal zones are home to nearly one billion people
-
The impact of severe storms is exacerbated by higher sea levels
-
Sea level rise is not uniform everywhere. Ocean currents distribute heat unevenly, causing a larger rise in some regions. Similarly, some land surfaces are gradually subsiding (ex. delta regions) and are more vulnerable to rising sea level
-
Rising sea level contaminates ground water supplies with salt water and kills salt-intolerant coastal vegetation
-
Rising sea level impacts storm drains and wastewater systems in coastal urban areas
-
Rising sea level exacerbates normal high tide impacts, especially seasonal “king tides,” and recurrent El Nino events
-
Hundreds of millions of people will be displaced by even small increases in global sea level
(References: Climate.gov Climate Change: Sea Level and IPCC Special Report on the Ocean and Cryosphere in a Changing Climate, Summary for Policymakers)
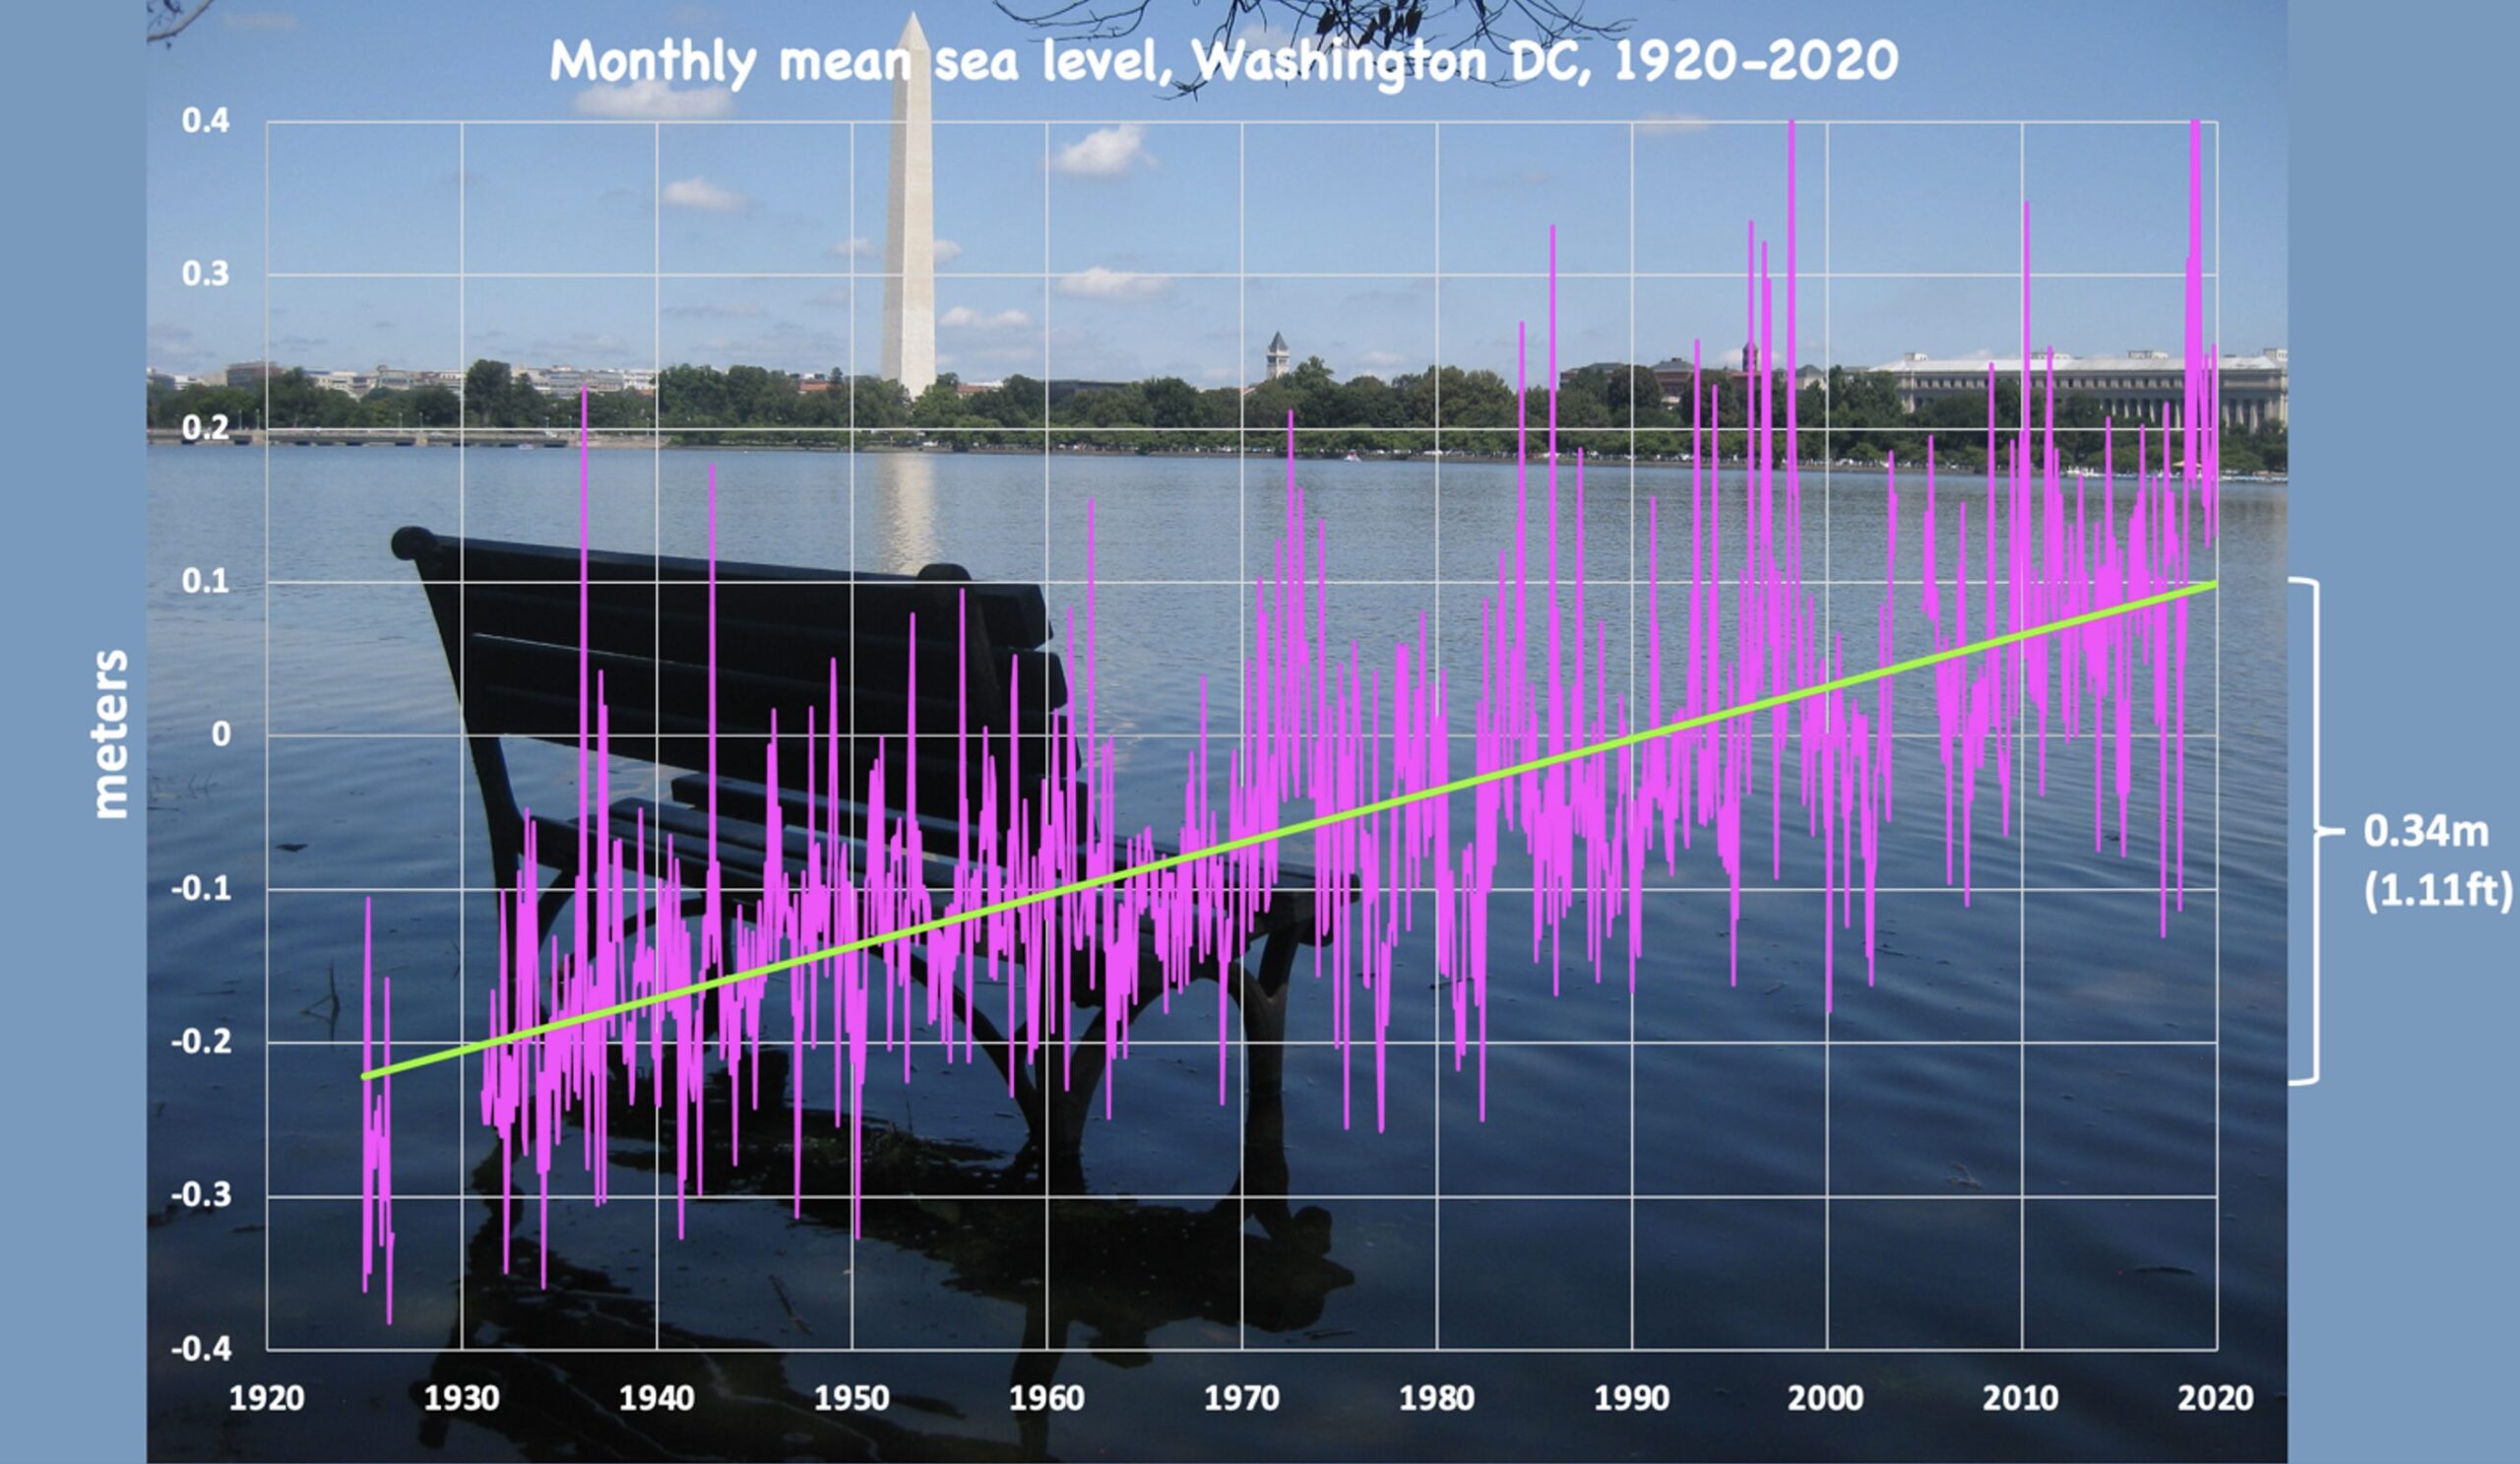
Sea level changes are monitored globally in real time, for example, by the National Oceanic and Atmospheric Administration (NOAA); see figures below.
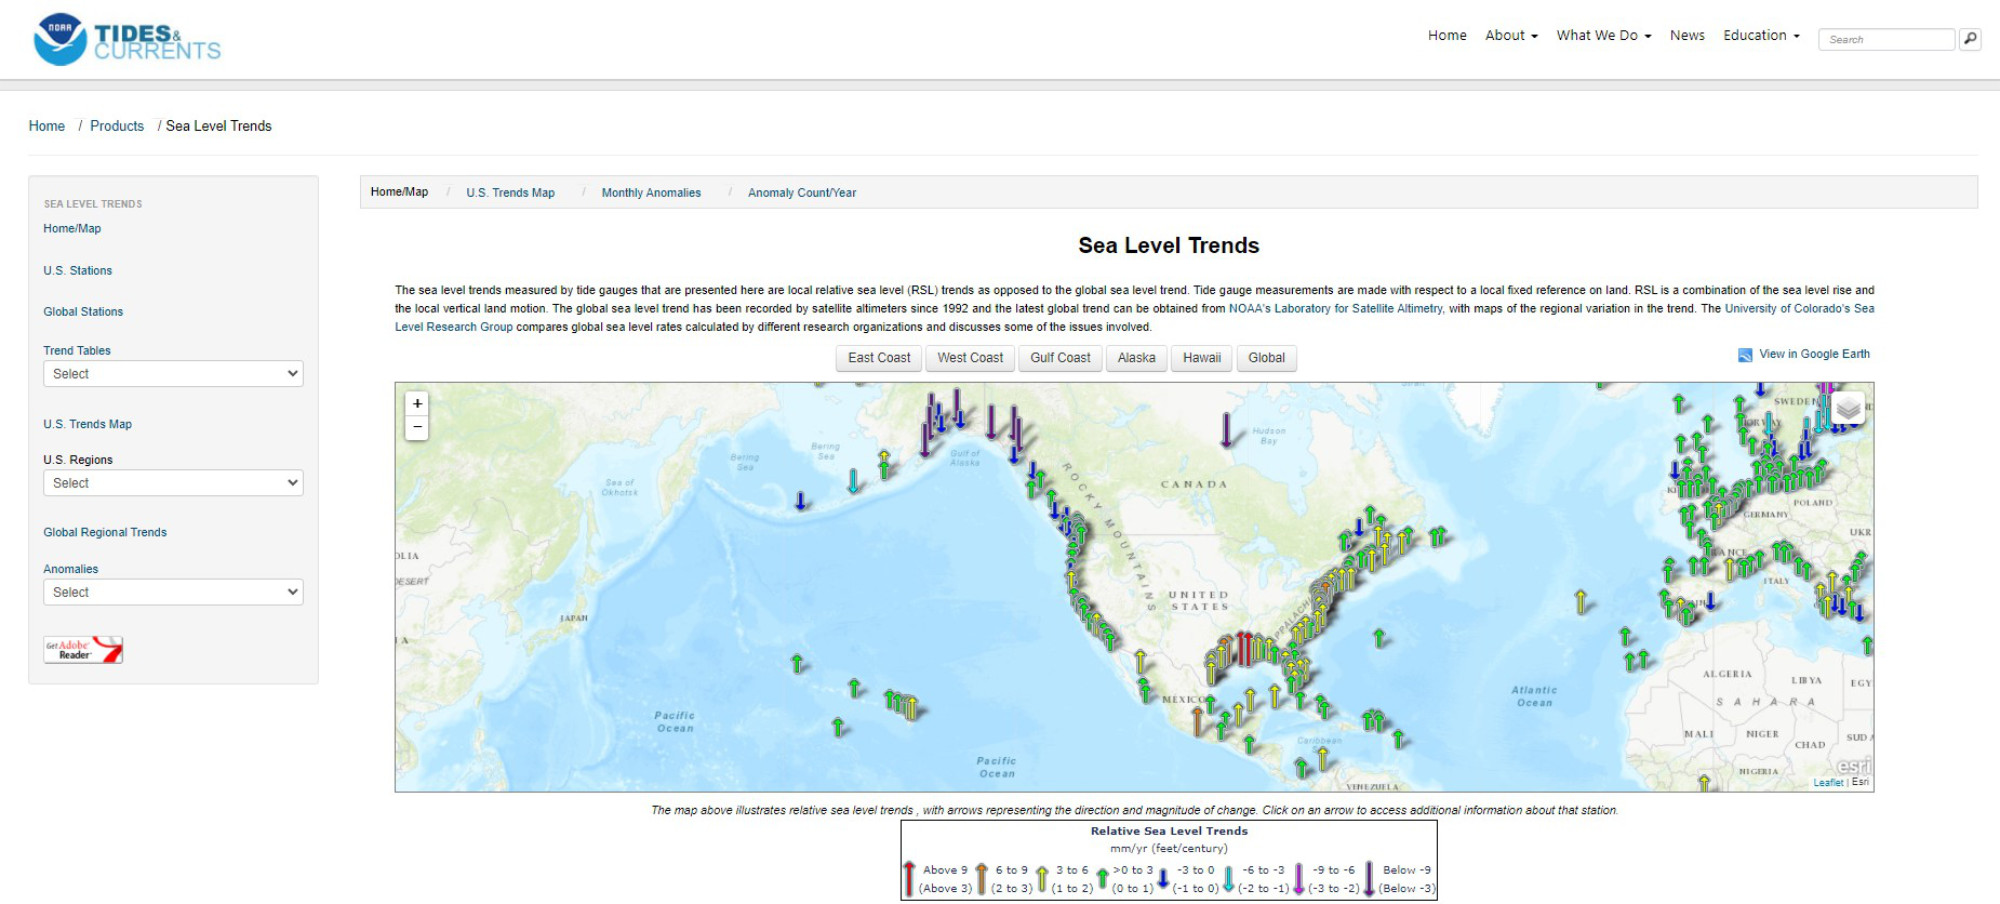
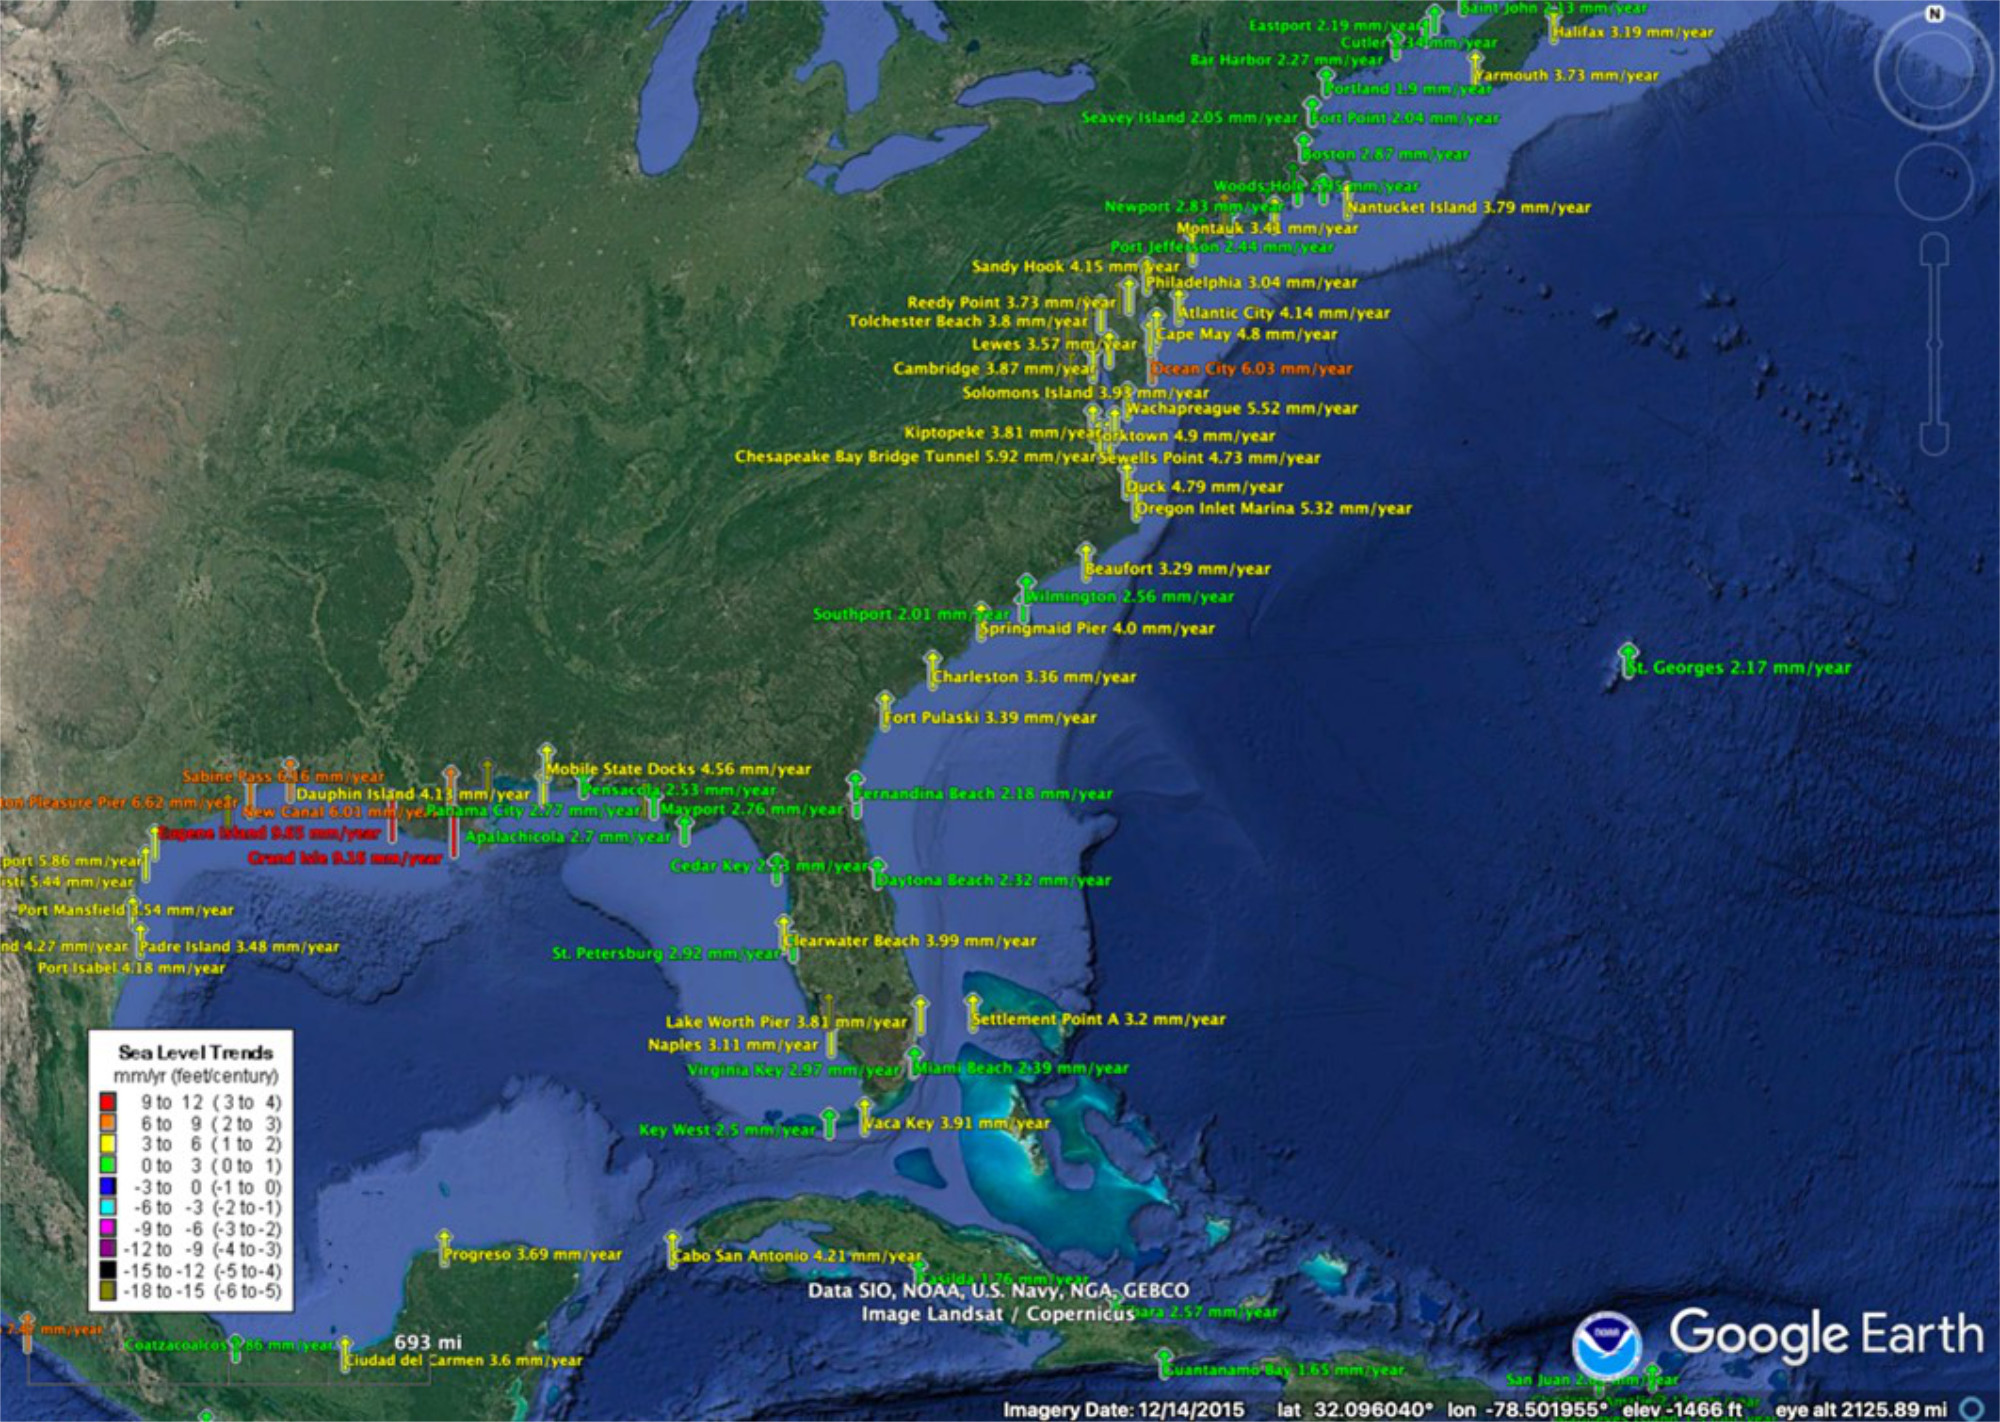
On the Atlantic and Gulf coasts of the US sea level is increasing everywhere. The tide gauge in the US capitol, Washington DC, shows an increase of over a foot of sea level rise in the last century, which had led to daily flooding around several national monuments.