

Overview
The concept addressed in this activity is to gain an understanding of geologic time. Consider the last glacial maximum, when the climate was cold enough to support the growth of an ice sheet that extended over much of North America. This ice sheet started to recede around 20,000 years ago, and the activity aims to help students comprehend such a large number of years. Although 20,000 years is not a long time relative to many other time scales in the Earth’s history, it is a long time compared with the time scales we are familiar with in daily life.
Introduction
Students work together to create a rope timeline that illustrates time scales of thousands of years compared with human lifetimes.
Grade Level
K-5
Learning Objectives
Students will work collaboratively to understand concepts of scale.
Lesson Format
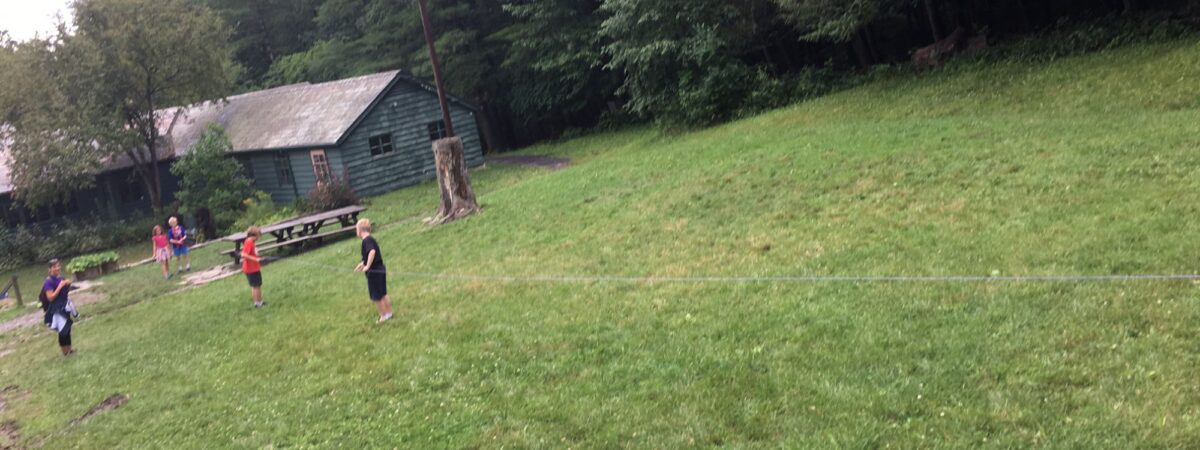
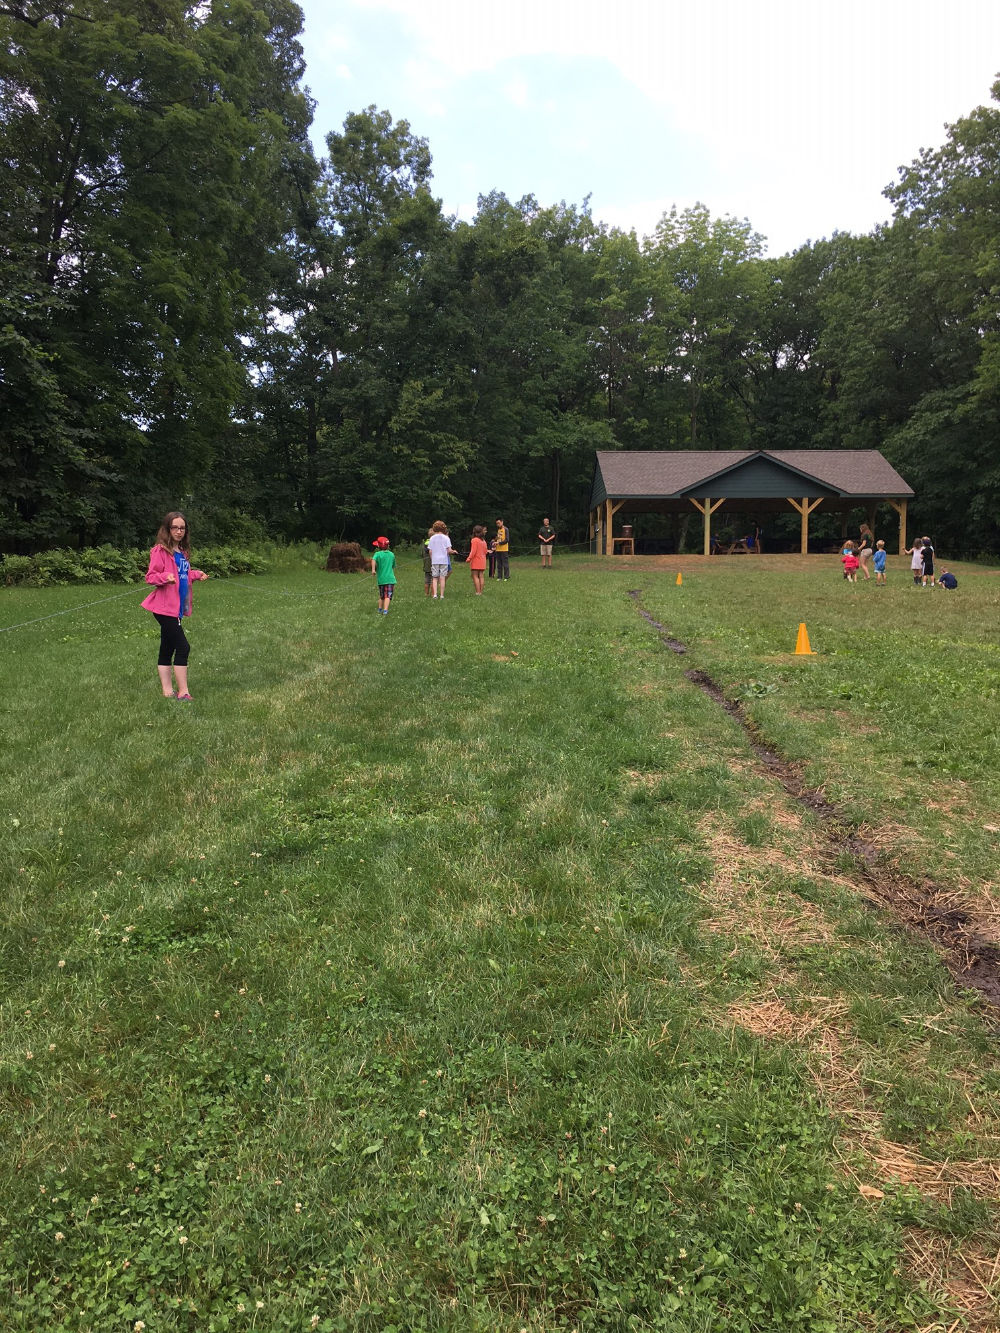
This activity can be done indoors or outdoors. Ideally it is done in a space that spans 60 yards, but it can be adapted to be done in a smaller space.
Time Required
30 minutes
Standards
NGSS
ESS1.C: The History of Planet Earth - Some events happen very quickly; others occur very slowly, over a time period much longer than one can observe. (2-ESS1-1) .
NOTE: this activity doesn’t directly cover the concepts in this standard, but it is a helpful complementary activity for understanding long time scales, such as thousands of years.
Credits & Contact Info
Dr. Ingrid Zabel
Paleontological Research Institution, 1259 Trumansburg Rd., Ithaca NY 14850
zabel@priweb.org
Instructions & Materials
Materials
- 60 yard-long rope
- The rope will be the timeline. The scale used for the rope is that 1 inch = 10 years.
- Ruler
- Marker, pen, or tape (needed to mark points on a rope)
Instructions
Provide background (NOTE: this background information is for New York State, but could be adapted for other locations.)
A long time ago, it was so cold in what is now New York State that the snow and ice didn’t melt in the spring and summer, and instead they built up over a long time to form a huge piece of ice called an ice sheet. It covered much of modern-day Canada and the northern U.S., and was about a mile thick over modern-day New York State. Then the climate changed and started to warm, and the ice started to melt. Today there are still ice sheets in the world, covering Greenland and Antarctica, but no ice sheets over North America.
IMPORTANT CONTEXT:
This climate warming happened naturally, as a result of changes in the Earth’s orbit around the sun and changes in the tilt and wobble of the Earth’s axis. Once this warming began, sea ice that covered large ocean regions began to melt and carbon dioxide was released from the ocean into the atmosphere. This accelerated the warming through the greenhouse effect. The melting sea ice also exposed more open ocean, which absorbs more energy from the sun than bright, white ice does. This resulted in even more melting of sea ice, as part of a reinforcing feedback loop that led to more warming.
The heating of the Earth that’s going on today is caused by humans burning fossil fuels and changing the way we use land. The natural cycle is still underway, but leads to changes over thousands of years, not hundreds or tens of years as we’re seeing now. If we don’t severely disrupt the natural cycle, we will be in another cold period about 80,000 years from now.
The ice sheet was at its biggest size around 20,000 years ago. That’s a long time ago! But since our lives are usually not more than 100 years, it’s hard for us to understand how long ago 20,000 years really is. Today we’re going to do an activity to help us understand that.
Steps:
- Explain that together you’re going to make something called a timeline, to count time.
- Estimate the average student age in the group.
- Suppose the average student age is 5 years. On one end of the rope, make a mark half an inch from the end. Explain that this represents 5 years. If the average age in the group is 10 years, then make the mark at 1 inch from the end, etc.
- Explain that the end of the rope is today, and then we’ll count time backward from there. If something is half an inch from the end of the rope, it means it happened 5 years ago. If something is 1 inch from the end of the rope, it means it happened 10 years ago, and so on.
- In other words, if you were born 10 years ago, your birth year would be 1 inch from the end of the rope.
- Add your (the teacher's) age to the timeline by making a mark on the rope. You could have the students guess your age, or just tell them.
- If 5 years = 0.5 inch, then 10 years = 1 inch, 30 years = 3 inches, 50 years = 5 inches, etc.
- Explain the meaning of where the mark is placed, e.g. “I was born 50 years ago.”
- Now measure out 1 yard, and tell them that this would be 360 years ago
- For older students, ask them to calculate how many years a yard represents.
- Tell the students that they are going to measure out 20,000 years on the rope timeline.
- Tell them (or have older students calculate) that 20,000 years ago would be 55.5 yards on the rope.
- Together, have the class extend the rope 55.5 yards. You can use a yardstick to measure, or estimate by wrapping the rope back and forth to judge distances.
- Once the rope timeline is fully extended, lay it down and ask them to walk the length of the rope, and compare their age on the rope, and their teacher’s age, to 20,000 years (almost the full extension of the rope.)
Discussion Questions
- When the students learned that they would be measuring out 20,000 years, how long did they think the rope would be in the end?
-
Is a human lifetime long or short? Compared to what?
-
What do they think happened in the lives of humans, animals, and plants that lived between 20,000 years ago and now?
-
Many events on our Earth happened over much longer time scales. For example, dinosaurs existed for about 165 million years, between about 230 and 65 million years ago. How long do they think the rope would have to be to represent one million years? (Answer: 2,778 yards, or about 1.5 miles)
Teaching Tips
It’s good to establish a process for extending the rope, so all students get a chance to participate and so the rope doesn’t get tangled.
If you're doing the activity in a space that's less than 60 yards long, direct the students to double back the rope as needed while they are extending it.
Background & Extensions
Ice Sheets
This activity discusses ice sheets, but people are often confused by different types of ice on the surface of the Earth. Ice sheets are a type of glacier, and a glacier is a large mass of ice that sits on top of land and can flow. Glaciers form in cold parts of the world such as polar regions and on top of high mountains. Ice sheets are the largest types of glaciers. For example the Antarctic ice sheet covers almost the entire continent of Antarctica.
This activity mentioned an ice sheet receding. Ice sheets recede, or shrink, when temperatures warm to the point that the rate of melting from an ice sheet exceeds the rate of replenishment of the ice sheet by falling snow. Many glaciers around the world are currently receding because of the Earth heating up.
The diagram below shows an ice sheet as well as a few other forms of ice one might find in polar regions. Icebergs are large pieces of ice that have broken off from a glacier or ice sheet at the edge of the sea, and these pieces of ice float in the ocean.
Sea ice is a layer of ice that forms when seawater freezes. Sea ice in the Arctic Ocean can be up to 2 m thick, though the thickness and extent of Arctic sea ice has been declining for the past several decades.
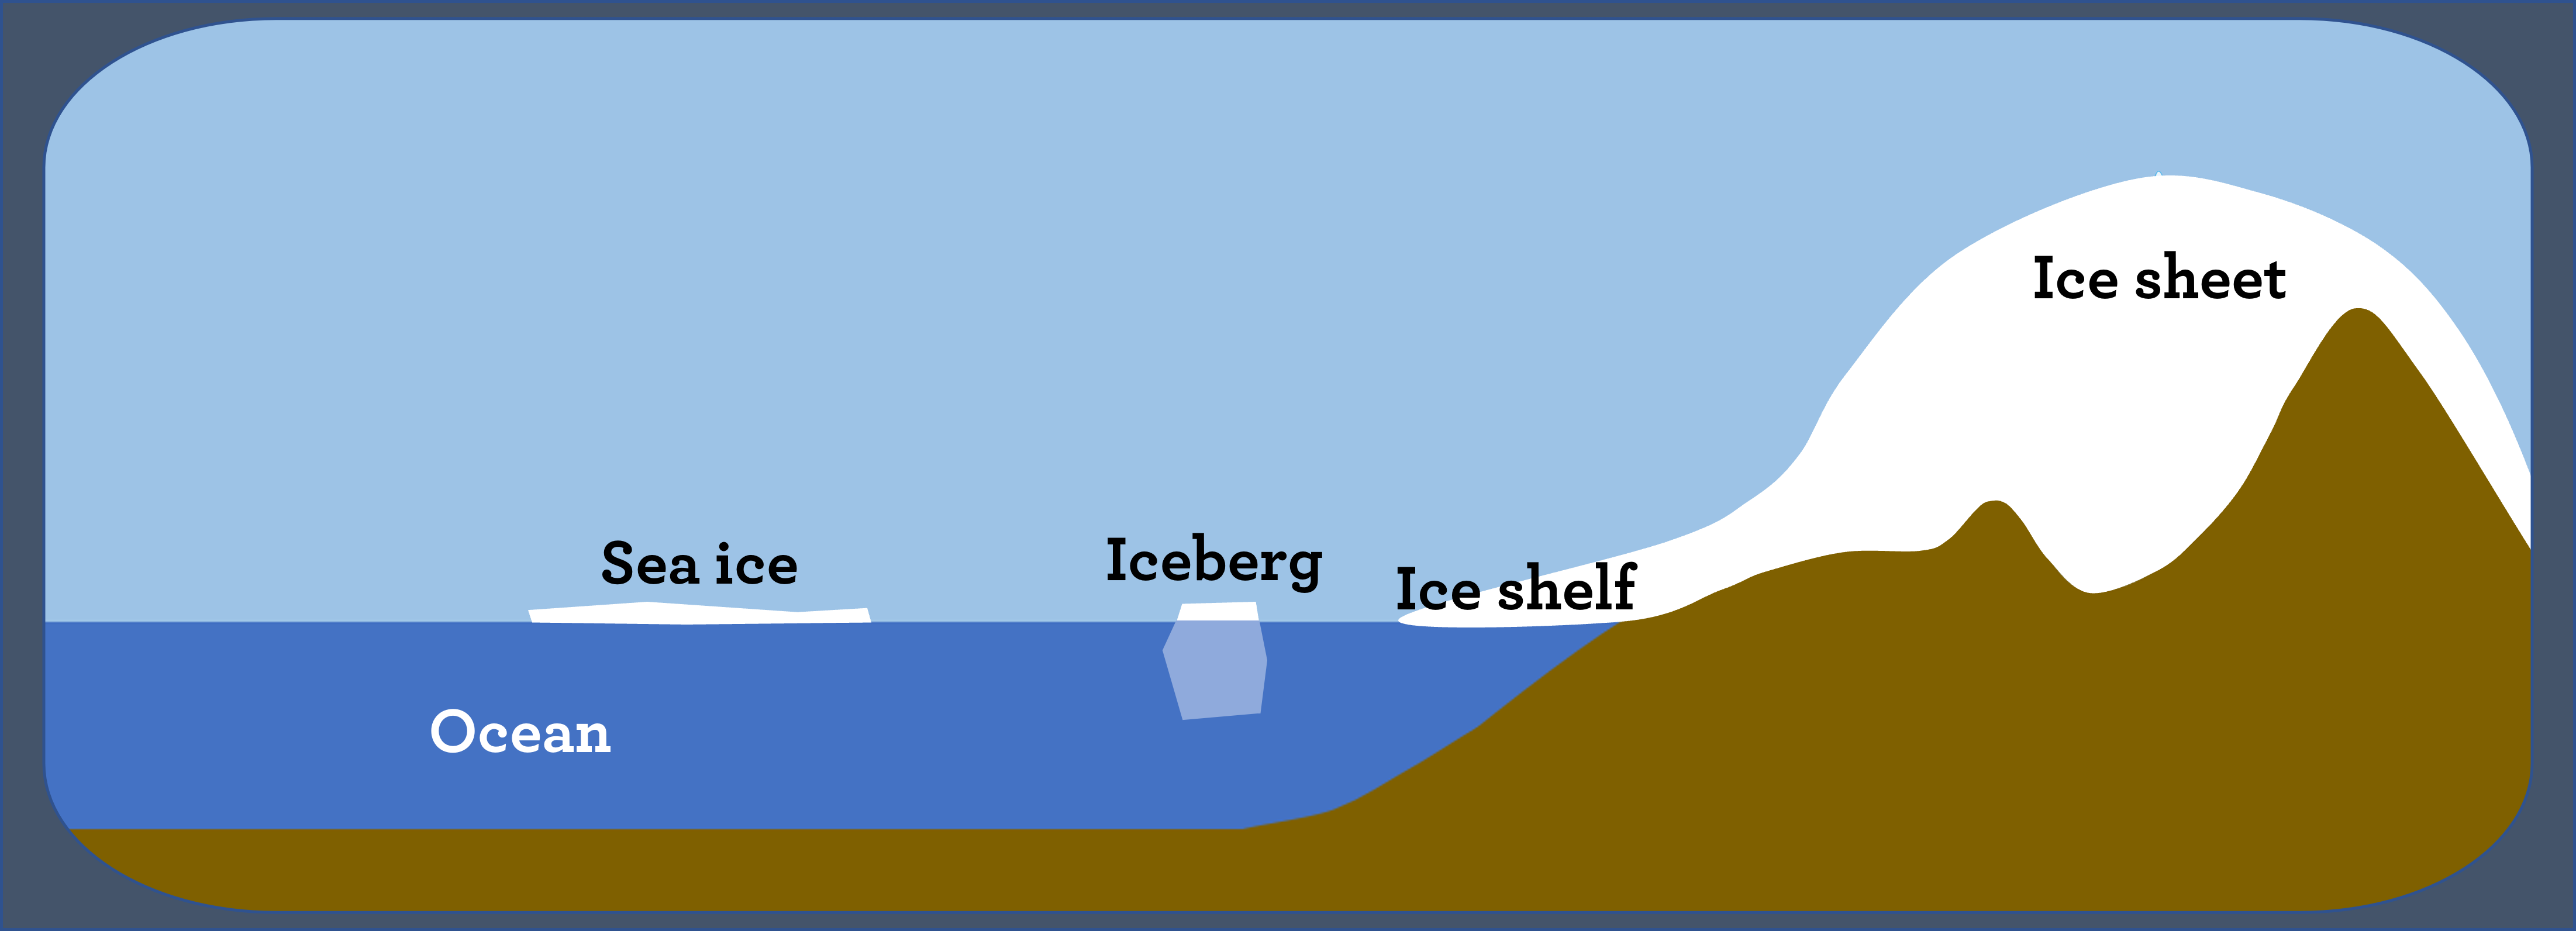
Note: this diagram is not to scale; it is just meant to show some different types of polar ice. For example, ice sheets are much thicker than sea ice is and the diagram doesn't portray the actual scale difference. Figure created by Ingrid Zabel for PRI's Earth@Home project (CC BY-NC-SA 4.0 license).
Extension to Distance Scales
For upper elementary students who have learned division and maybe have some understanding of distance scales on maps, you could extend this activity to consider distance scales as well as time scales. The example you could use is the thickness of the last ice sheet that covered New York State. The ice sheet was about a mile thick.
You could have students compare the length of a mile (5280 feet) to the height of a 5-story building (about 50 feet). Using a long piece of paper, ask them to draw a 5-story building and the ice sheet covering it, requiring that they get the proportions correct.
To get the scale factor to compare the height of the ice sheet to the height of a building, they would have to divide a mile by 50 feet (5280 ft./50 ft. = 105.6) to see that the height of the ice needs to be about 106 times greater than the height of the building.
Then they would have to plan their drawing to achieve this. One example solution would be to draw a building 1 cm high, and then draw the ice sheet 106 cm high. If they draw the building quite large to begin with, they’re going to need a very long piece of paper to be able to fit the ice sheet in!