


Overview
Temperature plays a huge role in how our weather works. Using water, we learn about how temperature is really energy, and how energy transforms the water through the three phases of matter: solid, liquid, and gas. We also discuss the difference between linear relationships (like a 1:1 correlation) and stair-step, or threshold, relationships (like the phase changes of water).
Introduction
In this activity, after we learn how temperature is a measure of energy, we become a group of water molecules undergoing phase changes together.
Grade Level
K-5, 6-8
Learning Objectives
Students will be able to explain that temperature is a measure of energy, and to assess the role of temperature in the phase changes of water, which impacts the climate.
Lesson Format
This activity can be done indoors!
Time Required
1 hour
Credits & Contact Info
Trisha Smrecak and Caroline Boyajian
Paleontological Research Institution, 1259 Trumansburg Rd., Ithaca NY 14850
climate@priweb.org
Instructions & Materials
Materials
- Pen and paper
- Ruler
- Bucket
- Measuring cups (enough of all groups or individual student)
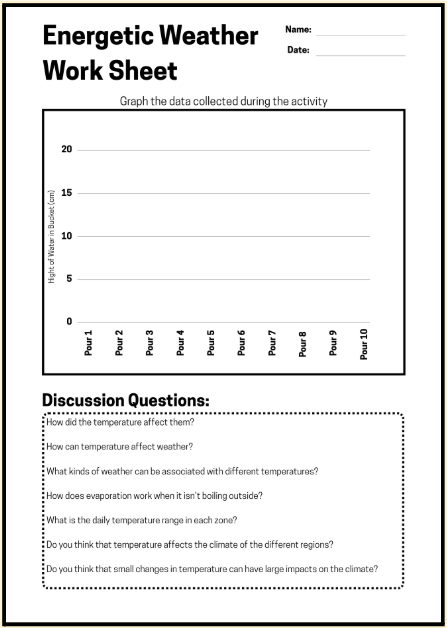
- Energetic Weather worksheet
Instructions
Part 1
- Assign one person to be the official recorder and another to be the official measurer; give the rest of the youth cups filled with equal amounts of water.
- One by one, have each youth pour their cup into the empty bucket. Between each pour, measure how high the water in the bucket is, and have that information recorded. Pour 1: 2 inches
Pour 2: 4 inches
Pour 3: 6 inches
-
- Work with youth to graph the data (number of pours vs. height of water in bucket) on a large sheet of paper or chalkboard. The graph may end up looking something like this:
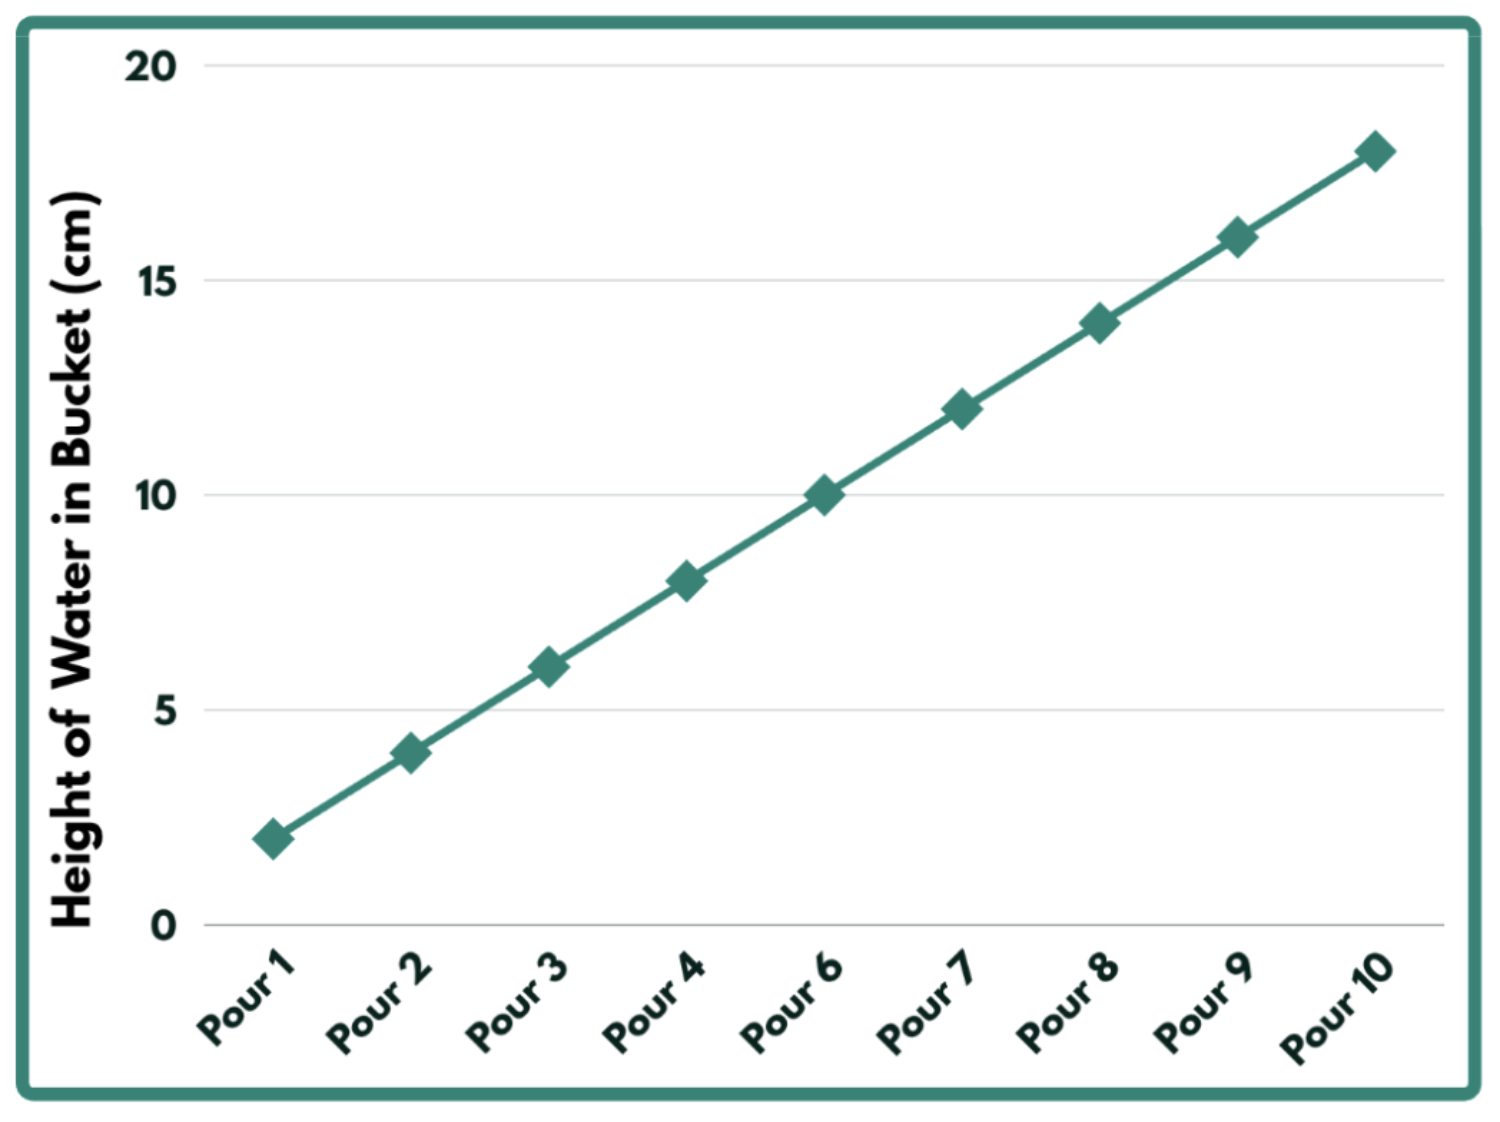
- Explain that this is a linear relationship, that for each cup poured into the bucket, the height of the water went up about the same amount, which is why the graph shows a nearly straight line.
- Have students compare their graph with the stair-step graph below. Discuss what is similar (both go up over time) and what is different (the 1st graph shows a linear relationship and goes up an equal amount each time, but the stair-step graph is exactly the same for some amount of time and then dramatically rises).
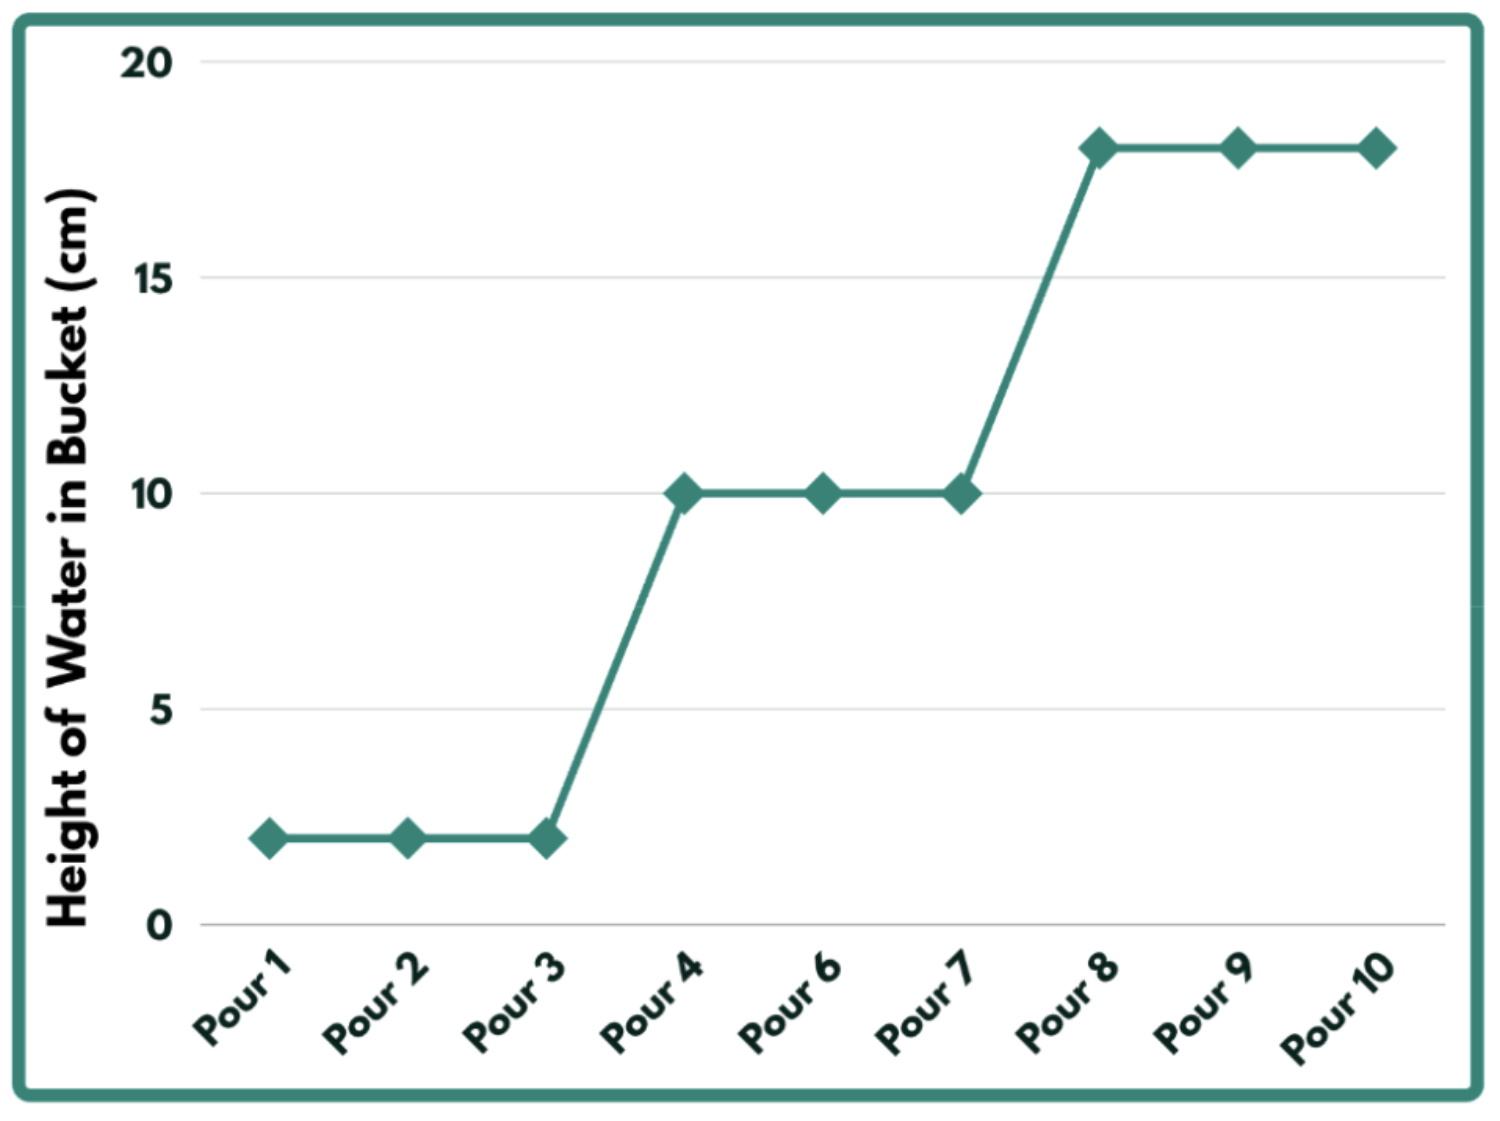
- Explain to students that the stair-step graph represents the phase of water as its temperature is changed. Ask what happens to water when it is really cold, below 32 degrees Fahrenheit (they respond that it is ice). Ask if it gets much colder, what happens to the ice (they respond that it stays in ice form).
- Ask what happens when you boil water and it gets above 212 degrees Fahrenheit, the boiling point (they respond that it turns to steam or evaporates). Ask what happens to evaporated water when it gets even hotter (they respond that it stays evaporated; it doesn’t do anything else).
- Ask them to guess where on the staircase graph might be the freezing point, and where the boiling point might be (time 4 and time 9, respectively). Discuss with them what is happening at each time before the water melts (Time 1 could be 29 degrees, Time 2, 30 degrees, Time 3, 31 degrees, and Time 4, 32 degrees). Time 5 is unique because the temperature must go above 32 degrees, a threshold point that causes a phase change from solid to liquid. Similarly, at the boiling point (time 9), the temperature must go above 212 degrees, another threshold point that causes a phase change from liquid to gas.
Part 2
- Explain that temperature is energy. When a substance is at a higher temperature, the molecules in the substance have more energy and move around more rapidly than when the substance is at a lower temperature. Threshold points in water happen when water molecules either absorb or release energy and change phases. Then tell the youth that they will simulate water molecules that are being affected by temperature.
- Ask the youth to form a human ice cube, reminding them that ice is cold and has a low energy level. Tell them the temperature is really cold, around 20 degrees (F). Encourage them to shiver, displaying the energy in their water molecule. Help them create a shape that is organized, with youth close together in a square shape. They should look something like the diagram below.
O O O O O
O O O O O
O O O O O
- Remind them that they are water molecules in the form of ice, and even though there isn’t a lot of energy present, there is some. Encourage shivering, wiggling, and other slight movements to simulate the energy in the water molecules.
- Tell them the temperature is now 25 degrees (F). What would happen to their water molecules and ice cube? (It should stay the same shape, without the youth moving their feet, but movement in the ice cube should increase)
- Tell them the temperature is now 30 degrees. What would happen to their molecules and the ice cube now? (The shape remains, the movement increases again) Remind students that water molecules can gently tap one another as they move.
- Tell the youth that the temperature is now 33 degrees. Before they begin to move, ask what their ice cube is turning into (water). Ask them about the properties of water (that it flows around but doesn’t fill up the entire space it is given). As they become liquid water molecules, remind them that they should always be able to touch a neighboring water molecule because water cannot expand too far. Also, the temperature is cold, so they don’t have too much energy to move around. This means that they can flow freely in any direction as long as they stay within arm’s length of other water molecules.
- Tell the youth that the temperature has increased to 75 degrees. Youth can move faster, but still need to be able to touch one another at all times.
- Tell the youth that the temperature has increased to 200 degrees. Movement should increase, but youth still need to be able to touch one another. There shouldn’t be any running, jogging, or speed walking. Encourage youth to move in other ways.
- Tell the youth that the temperature has increased to 212 degrees (boiling point). Before they move, ask what happens as liquid water boils (it turns to gas). Ask about properties of gas (still able to flow, fills up all available space it’s given), and ask them to mimic those properties. Youth no longer have to be within reach of one another. If space allows, speedwalking, jogging, and running can happen. Youth may continue to gently bump into one another if space allows. 10. You may wish to reverse the process for the students, returning them to a liquid and a solid before bringing them together for discussion.
Discussion
Ask the youth what they learned from being a water molecule. How did the temperature affect them? From what they learned, how can temperature affect weather? What kinds of weather can be associated with different temperatures? How does evaporation work when it isn’t boiling outside? (The Sun heats up individual molecules, so temperature doesn’t have to be boiling outside for water to evaporate) Discuss how different regions of the world have different climates, citing rainforests, temperate zones, the Polar regions, and deserts. What is the daily temperature range in each zone? Do you think that temperature affects the climate of the different regions? Do you think that small changes in temperature can have large impacts on the climate?
Extensions
CoCoRaHS Extension Ideas:
Using the map of the United States provided by CoCoRaHS, have students locate regions on the map where water can be found in each phase: solid, liquid, and gas. Discuss with them the importance of the phase of water in the region (Colorado/Rocky Mountains have constant snowcover, good for tourism, provides meltwater for valley cities; Seattle, west coastline has lots of cloud cover because the Rocky Mountains create a rain shadow effect, provides lush forests and animal life, fertile soils for farming; Great Lakes region has lots of water for tourism, farming, shipping industry), and what would happen if the water resource wasn’t there for each community.