


Overview
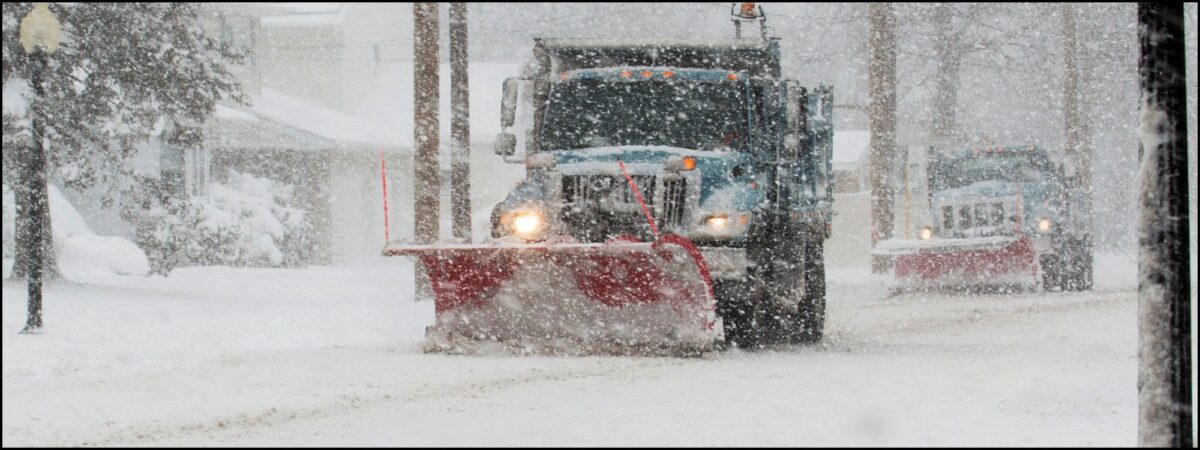
We know a lot about what conditions create rainfall or snowfall in an area. However, we are constantly looking to better understand the spatial variability of rain and snow, like why one house might get 3 inches of snow but, down the road, a friend’s house only had one inch of snowfall.
Introduction
This activity looks at how we measure snowfall and then creates precipitation contour maps to determine where the heaviest snowfall occurred. Contour mapping of precipitation is also used in weather forecasting to determine what areas will be most heavily impacted by potential snowfall.
Grade Level
K-5, 6-8
Learning Objectives
Students will be able to discuss that precipitation intensity can vary between places during a storm event. They will also be able to create a contour map and compare it to how the weather is predicted by media sources.
Lesson Format
This activity can be done indoors!
Time Required
1 hour
Credits & Contact Info
Trisha Smrecak and Caroline Boyajian
Paleontological Research Institution, 1259 Trumansburg Rd., Ithaca NY 14850
climate@priweb.org
Instructions & Materials
Materials
- Construction paper (various colors suggested)
- 15 to 20 recyclable cups
- Pen or marker
- Graph paper
- Towel or sheet
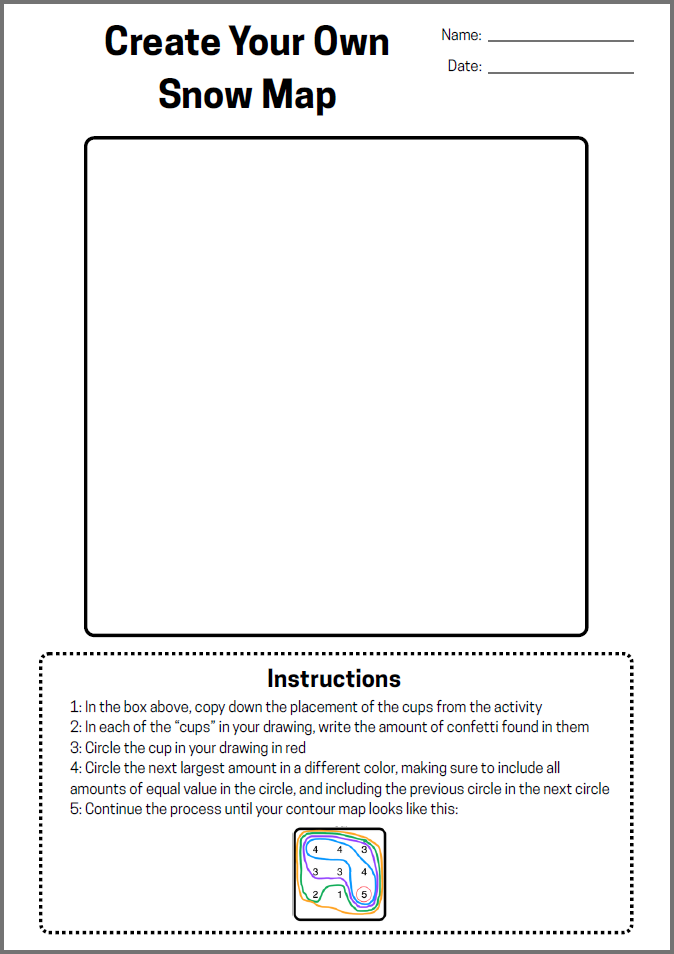
- Create Your Own Snow Map worksheet
Instructions
Preparation Needed:
Cut enough confetti out of construction paper for each individual to have a handful. If you like, and for older audiences, assign each color of confetti a different amount of snow, or decide that all colors will represent the same amount. For example, blue and green may be light snowfall, 1 piece = 1 inch of snow; orange and red may be heavy snowfall, 1 piece = 2 inches of snow.
Activity:
- Place the cups to form a grid on the floor (4x4, 5x3, 3x3, etc., depending on the number of participants). Use a sheet beneath the cups to minimize mess from confetti. Cups should be an inch or two apart. You may choose to cover a map of your county or state with cups instead of the grid, modifying subsequent directions to fit your experiment.
- Youth should draw on their graph paper a grid that matches the arrangement of the cups on the floor, noting the name or number of each cup and labeling them (if using a map, print out maps for each youth and have them mark where the cups are on the map). Assign each youth a cup(s) that will be their responsibility. Label cups accordingly, though be sure not to label the bottom of the cup.
- Grab a handful of confetti (or have the youth each grab a handful) and toss it randomly over the grid arrangement of cups.
- Have groups count the number of confetti pieces that fell in their cup (i.e., Cup 1 had 4 red pieces, 2 blue pieces, etc.) If different colored confetti is assigned a numeric value, be sure they record the number of each color. If not, color doesn’t matter. Make sure the youth record the numbers as they correspond to each labeled cup.
- Youth share information or record on one large paper/chalkboard how much snow confetti fell in each labeled cup.
- Total up the amount of snow that fell in their cups (4 blue and 2 red pieces = 8 inches of snow in Cup 2). Have the youth record the total amount of snow that fell in each cup on their grid sheet of paper in the corresponding cup.
- Youth should then make contour maps of snowfall by outlining all of the colored areas. This step works much better with older groups, so younger children may wish to do this in a directed group with the leader’s help.
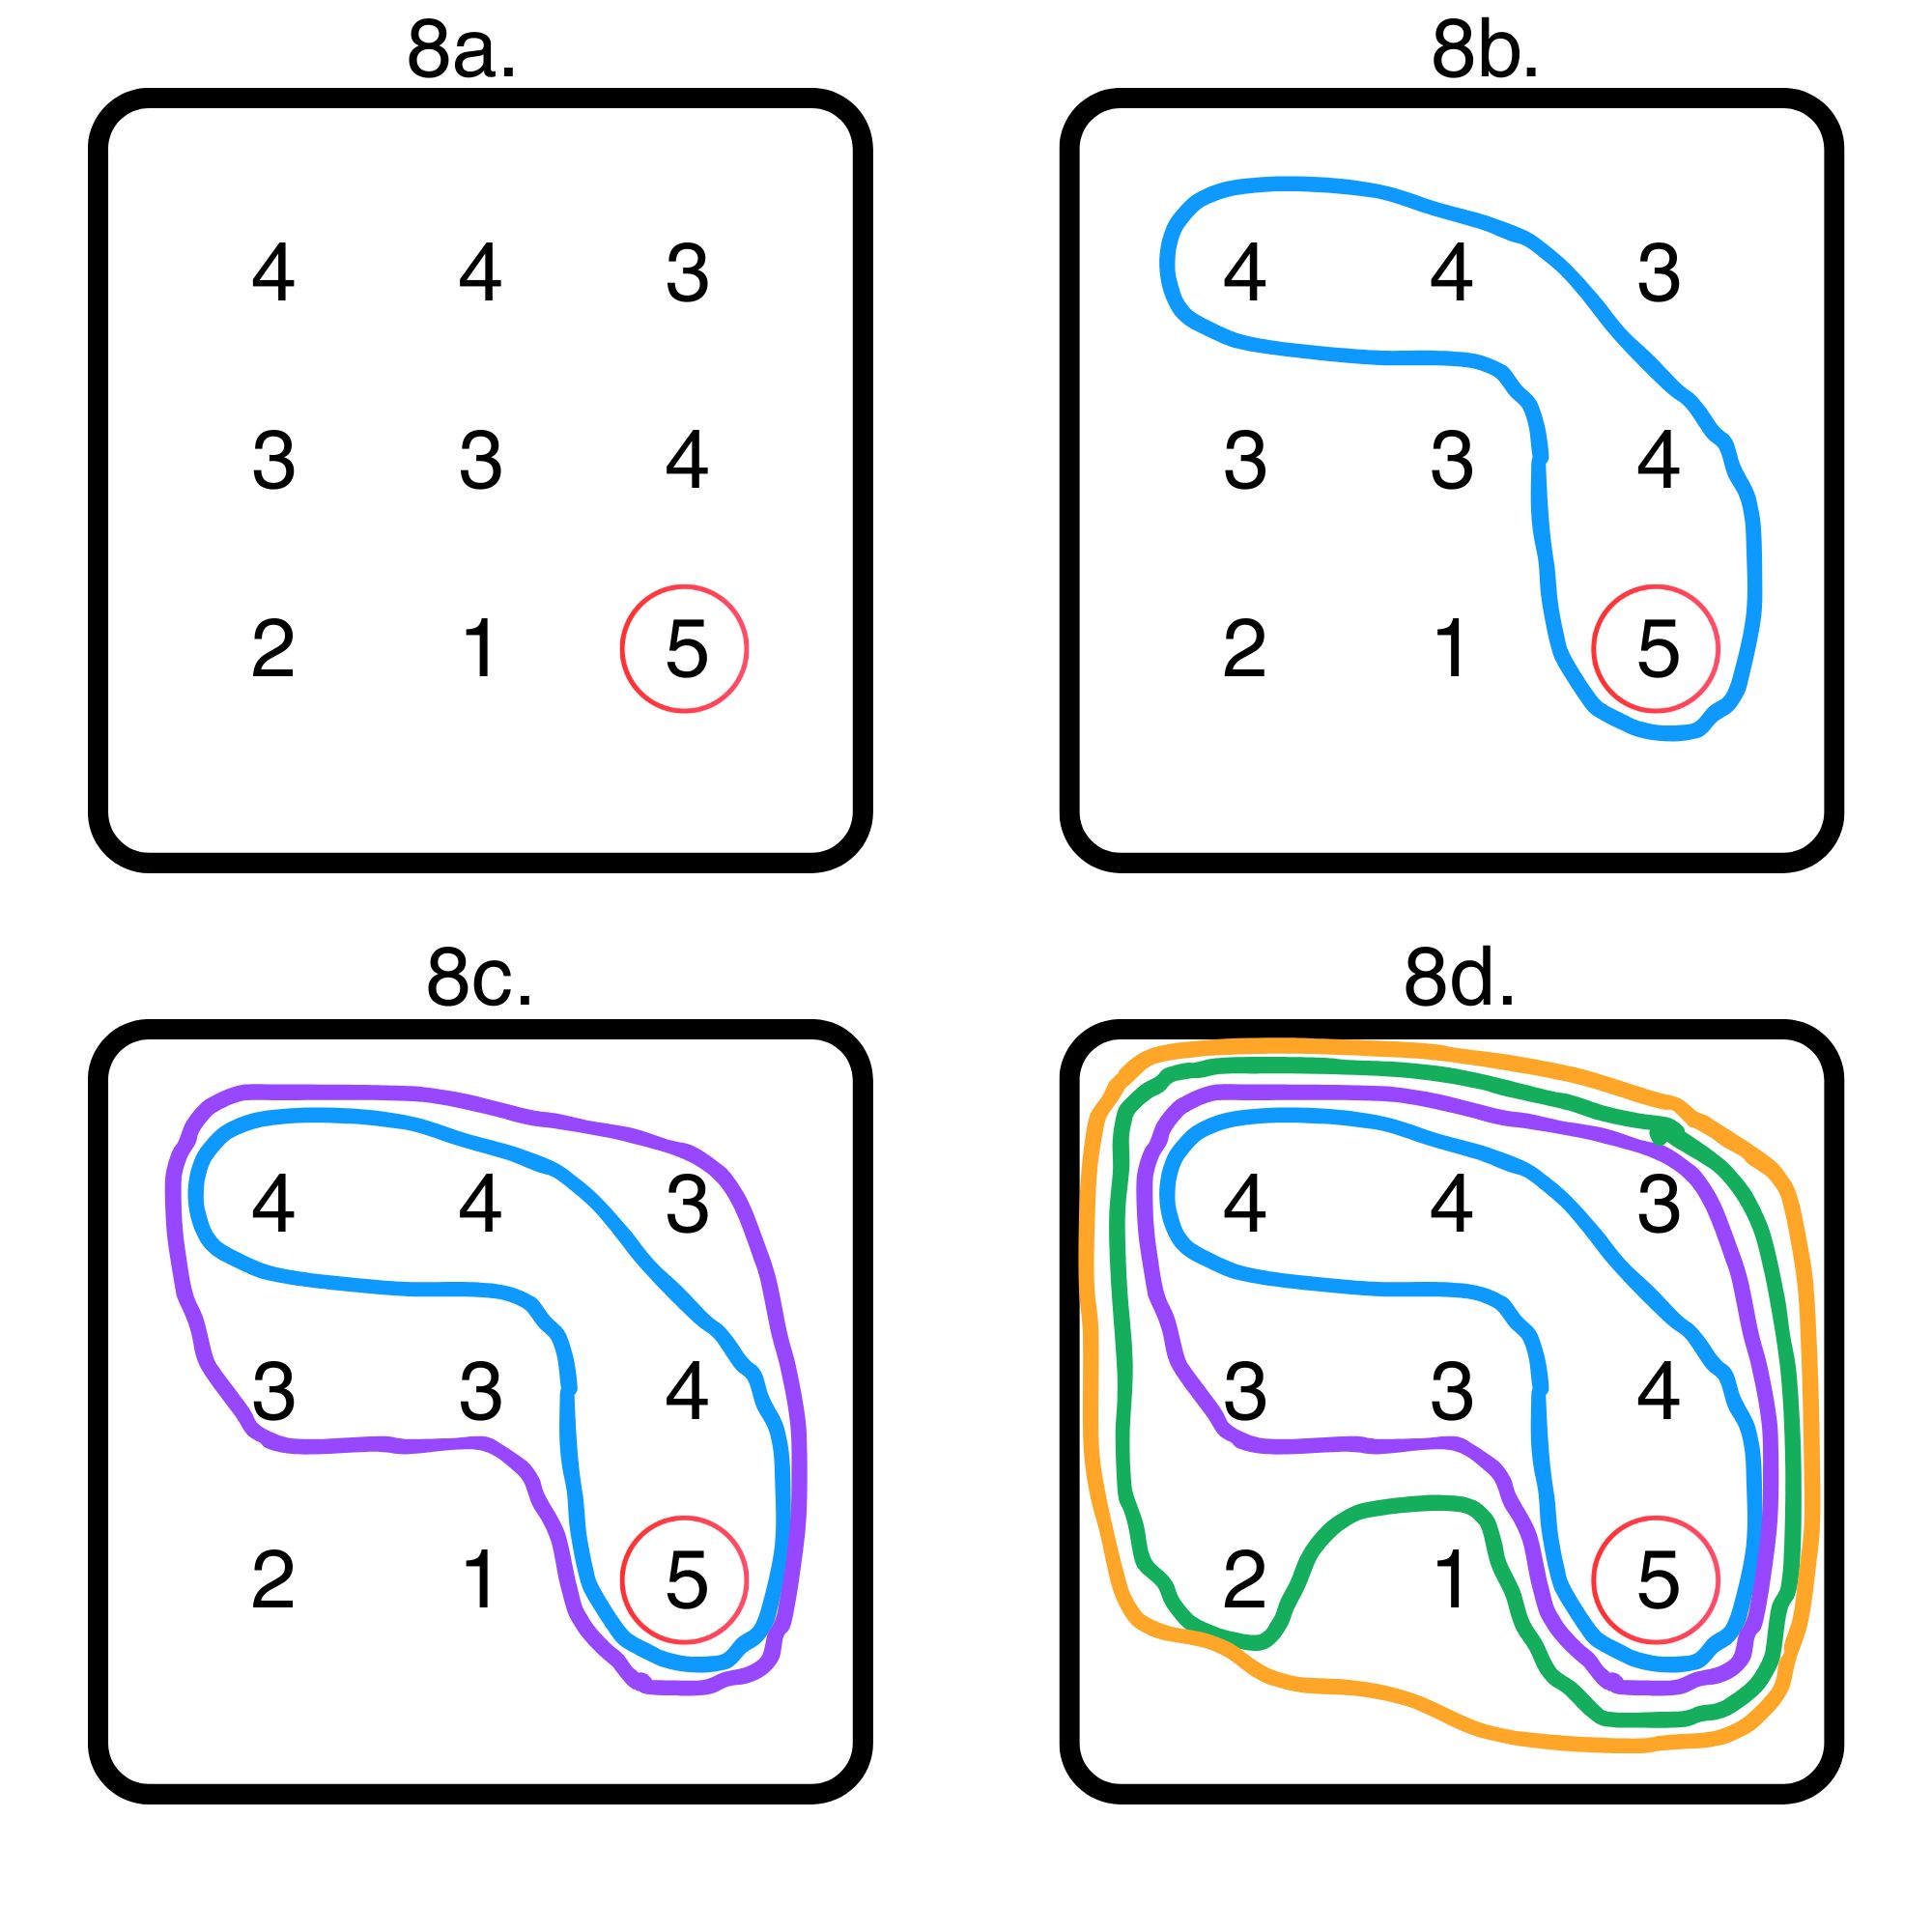
- Making a contour map: (See pictures below corresponding to step 8 a-d)
8a) Circle the cup with the highest amount of snowfall. If more than one cup has the same highest amount, make a circle that encompasses all of them, but none of the other snowfall amounts
8b) Find the cup(s) with the next highest amount of snowfall. Make a circle that encompasses them and the smaller circle with the higher amounts of snowfall. Be sure to avoid the lower amounts of snowfall.
8c) Find the next highest amount of snowfall.
8d) Repeat steps b and c until all snowfall amounts have been graphed in a contour map.
Discussion
This activity allows youth to see how variable snowfall and other forms of precipitation can be. These precipitation patterns do exist in real life and affect where people live, where animals live, and how snowfall that builds up in one area can replenish rivers and lakes in many other areas. These patterns can seem very random over an area, with one side of town getting hail or snowfall, and the other side of town having nearly no snow or hail. Further, their participation in CoCoRaHS (if applicable) is helping scientists to better understand this local variability.
Have the youth name different regions in the US that experience different amounts of snowfall and other precipitation. Talk about how precipitation affects where people live. Some examples are below:
- Snow falls on a mountaintop year-round, but few people live in mountainous areas; yet the snow melts into the valleys below, where people have settled
- Snow falls in the northern U.S. states. That snowmelt trickles down lakes and streams and feeds more arid regions in the south, like New Mexico and Arizona.
Extensions
CoCoRaHS Extension Ideas:
After a heavy snowfall in your area, print off a CoCoRaHS map of your state or county with all of the stations and their recorded snowfall data. Using what you’ve learned from this activity, draw a contour map of snowfall in your area and determine which parts of the county or state were hit hardest and which received little or no snow at all. Then, find the predicted pattern and amount of snow from a newspaper, weather website, or other source, and compare the actual results with those predicted.
Another idea is to make a 3-D model of real contour map data from precipitation measurements taken by CoCoRaHS observers. Visually represent the amount of snowfall with Play-Doh, papier-mache, or by some other means.