

Ocean - Energy
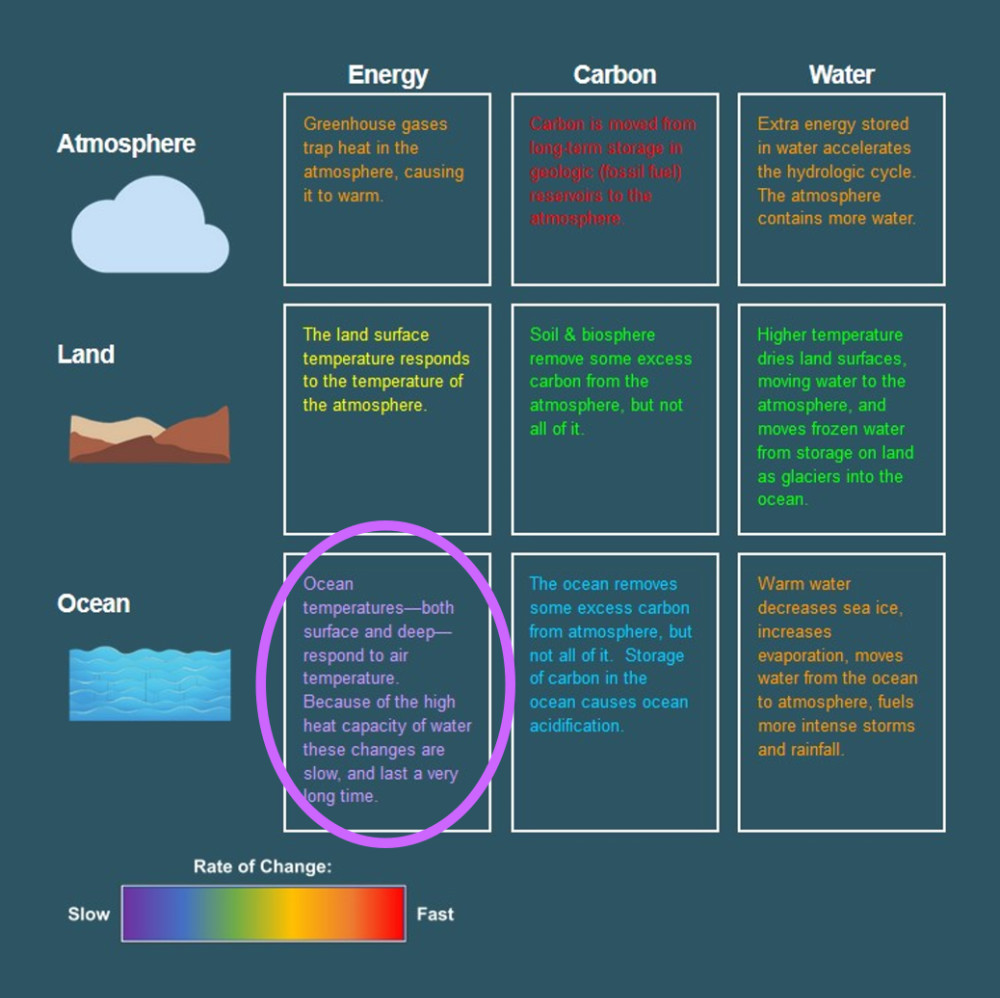
Ocean temperatures – both surface and deep – respond to air temperature. Because of the high heat capacity of water these changes are slow, and last a very long time.
IPCC Summary for Policymakers (SPM) content
-
A.4.3 Heating of the climate system has caused global mean sea level rise through ice loss on land and thermal expansion from ocean warming.
-
A.1.7 Global mean sea level increased by 0.20 [0.15 to 0.25] m between 1901 and 2018.
-
A.1.6 It is virtually certain that the global upper ocean (0–700 m) has warmed since the 1970s and extremely likely that human influence is the main driver.
-
B.5.1 Past GHG emissions since 1750 have committed the global ocean to future warming (high confidence). Over the rest of the 21st century, likely ocean warming ranges from 2–4 (SSP1-2.6) to 4–8 times (SSP5-8.5) the 1971–2018 change. Based on multiple lines of evidence, upper ocean stratification (virtually certain), ocean acidification (virtually certain) and ocean deoxygenation (high confidence) will continue to increase in the 21st century, at rates dependent on future emissions. Changes are irreversible on centennial to millennial time scales
Science Standards: NGSS SEP, DCI, CC
SEP: Analyzing & interpreting data
SEP: Engaging in argument from evidence
PS3.B Conservation of energy & energy transfer
ESS2.C Roles of water in Earth surface processes
ESS3.B Natural hazards
ESS3.D Global climate change
CC: Cause & Effect
CC: Energy & Matter
PRI Climate Resources
Greenhouse Video #5 Heat capacity